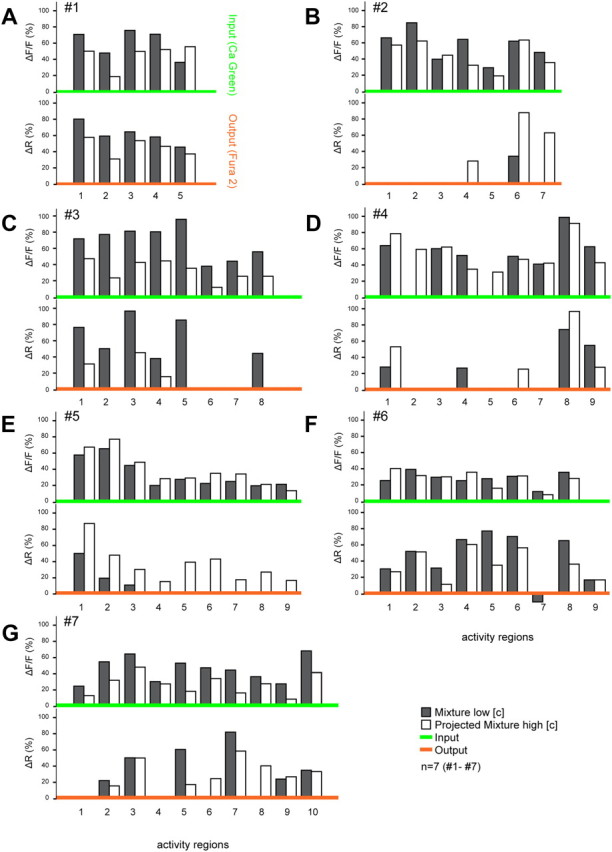
Figure 2.

Comparison of mixture representations in the AL at both input and output processing levels shows strong interactions in PNs suggesting network modulation. Black bars depict the normalized response activity to the mixture for each activity region (number differs among animals A–G from 5 to 10). To assess the predictability of response patterns, a projected mixture for each animal was created (white bars) using the maximum fluorescence change in all activity regions across every single component response tested at the mixture concentration (input and output respectively). Comparison of the measured mixture response (black bars) with the projected mixture (white bars) within animals showed that the mixture representation could generally be predicted from the response patterns of the single components at the input level (green x-axis, upper trace). PN mixture responses (output level, orange x-axis, lower trace) showed substantial loss and gain of activity regions compared with single component patterns. Thus, output patterns of single components did not typically reassemble the mixture response.
