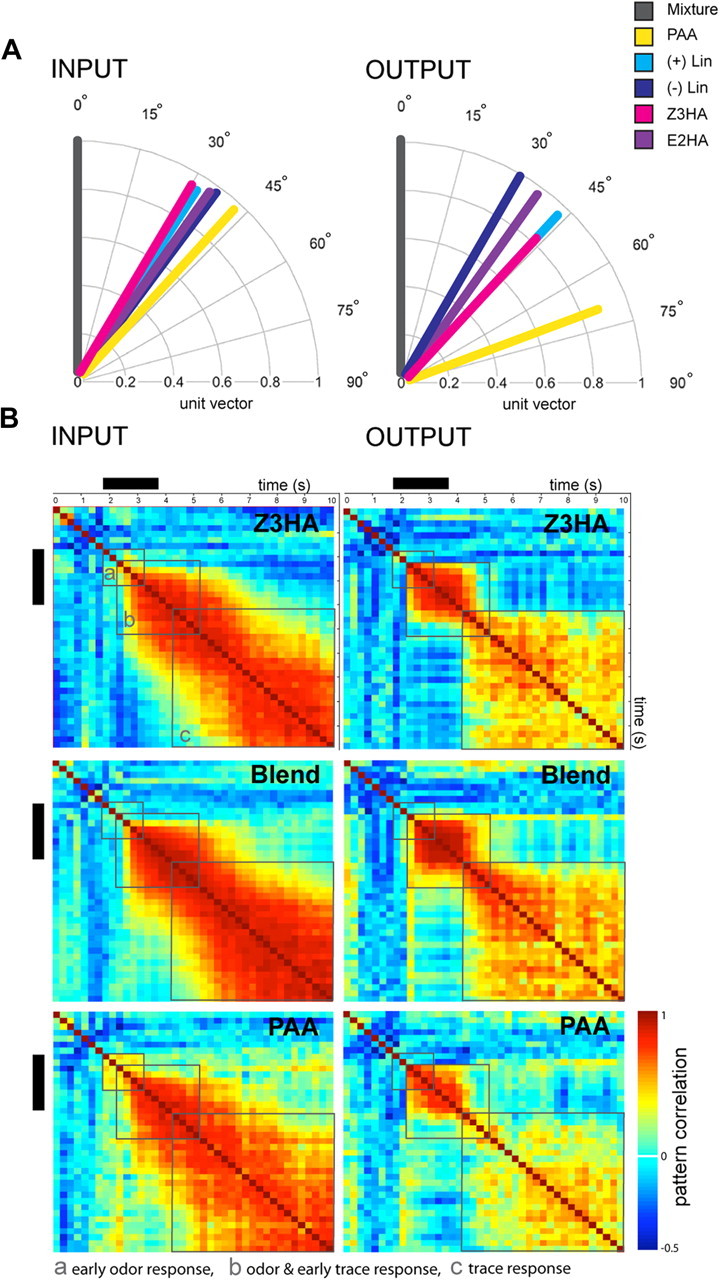
Figure 3.

Odor pattern similarity in the Manduca AL at two separate processing levels. A, Odor representation changes from input to output in the AL network (n = 8 for input, n = 7 for output). A resultant vector for each response pattern was calculated, and the dot product between vectors was used to determine the angle between mixture and single component responses tested at the mixture concentration [acos (dotproduct)]. Comparison of the mean angle of each of the single components compared with the mixture shows a spread at the PN level indicating network interactions at the output, most obvious for PAA. B, Odor response traces differ between OSNs (INPUT, n = 8) and PNs (OUTPUT, n = 7), and are odor specific. Correlation matrices depict the similarity of response patterns between measurements over time for selective odor stimuli at the mixture concentration. Response patterns are calculated as vectors with signal values of 66 activity regions for input and output responses, respectively. Each pixel represents the pattern correlation between two adjacent time points. PAA exhibits the most obvious spread and minimum pattern similarity over time not only in the time after odor onset (black bar) but across the entire 10 s recording. Similarity between response patterns was tested using a sliding window Pearson's correlation. Gray boxes indicate areas assessed for the (a) early odor response, (b) odor and early trace response, and (c) trace response. Black bars indicate stimulus onset (2 s odor pulse).
