
Figure 1.
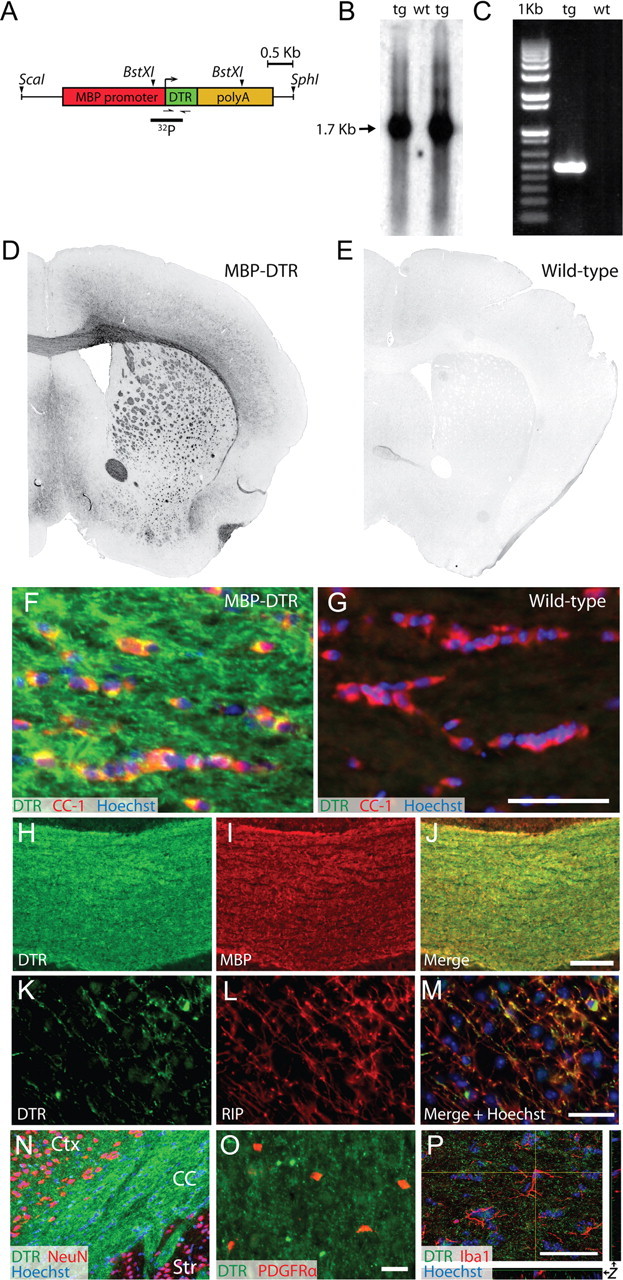
Generation of MBP-DTR transgenic mice expressing DTR within the mature oligodendrocyte population of the adult CNS. A, Schematic representation of the ScaI/SphI-linearized MBP-DTR construct used to generate MBP-DTR founders. The construct comprises the 1.94 kb proximal promoter of the mouse myelin basic protein promoter, the 627 bp human HB-EGF/DTR CDS, and the 1.43 kb 3′ splicing and the polyadenylation sequence derived from the human β-globin gene. Arrowheads depict the sense and antisense primers used for PCR genotyping. The solid black line indicates the size and position of the 32P-labeled probe used for Southern blot analysis of BstXI-digested mouse tail DNA. B, Southern blot analysis of BstXI-digested genomic DNA isolated from mouse tail biopsies used to identify MBP-DTR (tg) founders; note the absence of signal at 1.7 kb in the wild-type (wt) sample. Hybridization was performed using a 629 bp 32P-labeled DNA probe that identified a 1.7 kb BstXI fragment generated from the MBP-DTR sequence. C, PCR genotyping using primers that amplify a 512 bp product from the MBP-DTR transgene enabled discrimination of MBP-DTR (tg) from wild-type (wt) mice. D, E, Immunohistochemical assessment of DTR expression in the forebrain using an anti-human HB-EGF antibody revealed DTR expression within white matter tracts of MBP-DTR (D) but not wild-type (E) mice. F, G, Immunohistochemical assessment of DTR (green) expression among CC-1 (red) immunoreactive oligodendrocytes in the corpus callosum of MBP-DTR (F) versus wild-type (G) mice. Nuclei were stained with Hoechst 33258 (blue). H–J, DTR expression (H, green) in the corpus callosum colocalized with MBP (I, red), as revealed in the merged image (J). K–M, DTR expression (K, green) was localized to both the cell body and processes of RIP-labeled oligodendrocytes (L, red), as shown in the merged image (M). Nuclei were counterstained with Hoechst. N–P, DTR expression (green) was not observed in NeuN-labeled (red) neuronal cell bodies (N), in PDGFRα-labeled (red) oligodendrocyte progenitor cells (O) or in Iba1-labeled (red) microglia (P, confocal stack). CC, corpus callosum, Ctx, neocortex; Str, striatum; z, z-axis projection. Scale bars: F, G, K–P, 50 μm; (in J) H–J, 200 μm.