
Figure 5.
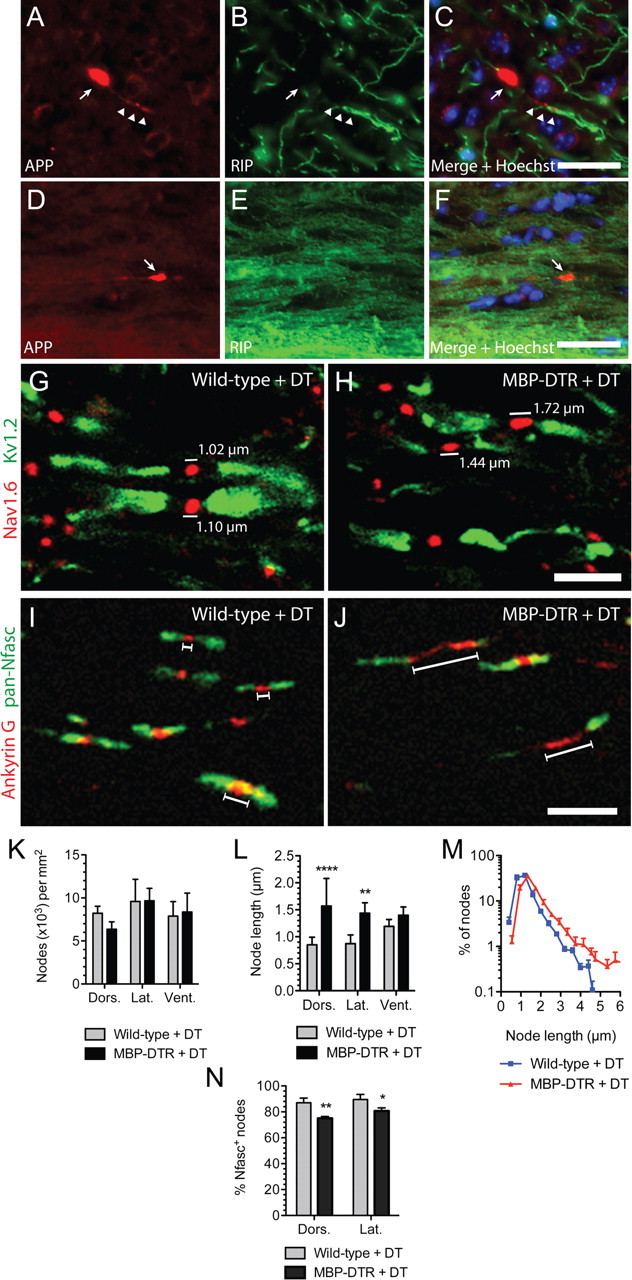
Pathological changes in axons and nodes of Ranvier following oligodendrocyte ablation. A–F, Immunohistochemistry against APP (A, D, red) and RIP (B, E, green) in the cerebral cortex (A–C) and corpus callosum (D–F) of a DT-challenged MBP-DTR mouse. Note the APP+ spheroid (A, arrow) proximal to an RIP-labeled myelinated fiber (B, arrowheads) shows evidence of APP accumulation along its length. C and F show the merged images with Hoechst 33342 counterstain. G, H, Immunohistochemical assessment of Nav1.6 (red) and Kv1.2 (green) expression at nodes of Ranvier in longitudinal sections of the dorsal funiculus of the lumbar spinal cord revealed lengthening of the Nav1.6-expressing domain at the node in symptomatic DT-challenged MBP-DTR mice (H) compared with the DT-challenged wild-type mice (G). Note the difference in linear measures of Nav1.6 labeling for given nodes in H versus G. I, J, Immunohistochemical labeling of neurofascin (Nfasc, green) and ankyrin G (red) in longitudinal sections of the dorsal funiculus of the lumbar spinal cord revealed lengthening of the ankyrin G-labeled domain at the node of DT-challenged MBP-DTR mice (J, indicated by white bars) and reduced or abnormally distributed Nfasc expression. K, Quantification of the density of nodal Nav1.6 expression revealed no change in node density within dorsal, lateral, or ventral aspects of the lumbar spinal cord. L, Measurement of the length of ankyrin G expression at nodes demonstrated a significant overall effect of genotype (p < 0.0001, two-way ANOVA) and post hoc analysis confirmed genotype-specific differences in the dorsal funiculus (p < 0.0001) and lateral column (p < 0.01, Bonferroni's post hoc analysis). M, Frequency plot of node length demonstrated a right shift in the distribution of node lengths in MBP-DTR + DT mice as opposed to wild-type + DT mice. N, Percentage of nodes defined by discrete ankyrin G expression that exhibited bilateral neurofascin (Nfasc) labeling. Two-way ANOVA revealed a significant overall effect of genotype (p = 0.0001) and a significant effect of genotype in both dorsal (p < 0.01) and lateral (p < 0.05) spinal cord (Bonferroni's post hoc analysis). Dors., dorsal; Lat., lateral; Vent., ventral. Data represent mean ± SEM. Scale bars: (in C) A–E, 25 μm; (in J) G–J, 5 μm.