
Figure 1.
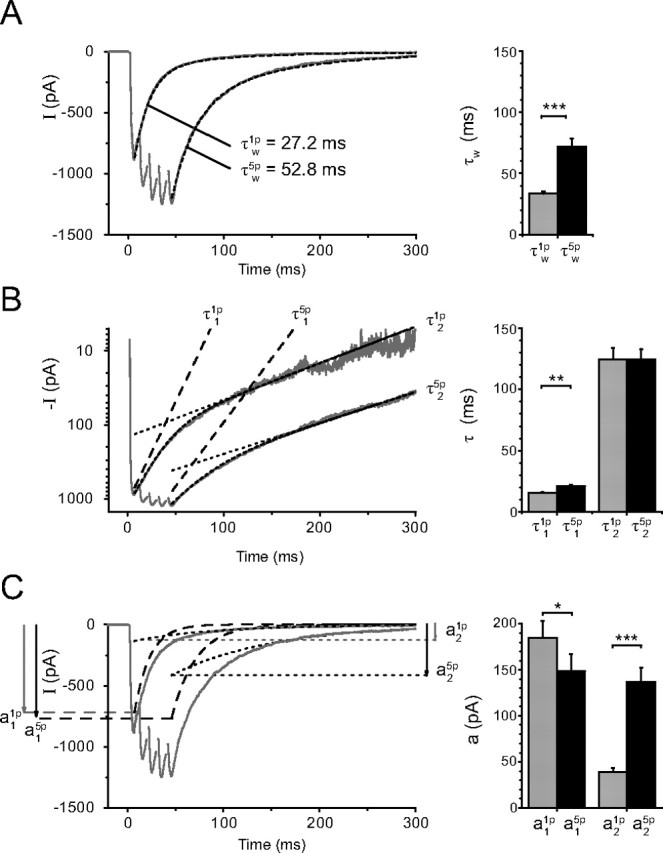
Comparison of the EPSCs evoked by a single stimulation (1p-EPSCs) and by a train of five stimulations at 100 Hz (5p-EPSCs). A, The weighted time constants describing the decay, noted τw(1p) and τw(5p), were obtained from a dual exponential fit with time constants τ1 and τ2 and amplitudes a1 and a2 (see Materials and Methods). Left, The weighted time constant was τw(1p) = 27.2 ms for the 1p-EPSC, and τw(5p) = 52.8 ms for the 5p-EPSC. The mean values were τw (1p) = 33.5 ± 1.9 ms and τw (5p) = 71.9 ± 6.6 ms (n = 23). The dual exponential fit is superimposed on the experimental records. B, The two time constants τ1 and τ2 are analyzed separately. Left, Logarithmic ordinate. The lines fitting the slow decay of the 5p-EPSCs are nearly parallel to those describing the slow decay of the 1p-EPSCs. Right, Results from 23 cells. τ2 was not significantly changed (τ2(1p) = 124.8 ± 9.0 ms; τ2(5p) = 124.7 ± 8.4 ms, p = 0.99). τ1 increased slightly (from τ1(1p) = 15.6 ± 0.8 ms to τ1(5p) = 20.8 ± 1.5 ms, p < 0.01). C, Evolution of a1 and a2 during a train. Left, The averaged EPSCs are superimposed on the theoretical lines (dotted lines) corresponding to the two exponentials used to fit the decay of the responses. <a1,τ1>, dashed lines; <a2,τ2>, dotted lines. In this experiment a1(1p) was slightly smaller than a1(5p), whereas a2(5p) was three times larger than a2(1p). Right, On average a1(1p) was slightly larger than a1(5p) (a1(1p) = 184.8 ± 18.4 pA; a1(5p) = 148.8 ± 18.0 pA, n = 23, p = 0.01) whereas a2(5p) was much larger than a2(1p) (a2(1p) = 38.9 ± 4.3 pA; a2(5p) = 136.9 ± 15.1 pA, n = 23, p < 0.001). A–C, The traces on the left correspond to the average of 10 sweeps, whereas the bar graphs on the right correspond to the data from 23 experiments. The statistical significance of the data in the bar graphs is coded by symbols according to the value of p (*p < 0.05; **p < 0.01; ***p < 0.001).