
Figure 3.
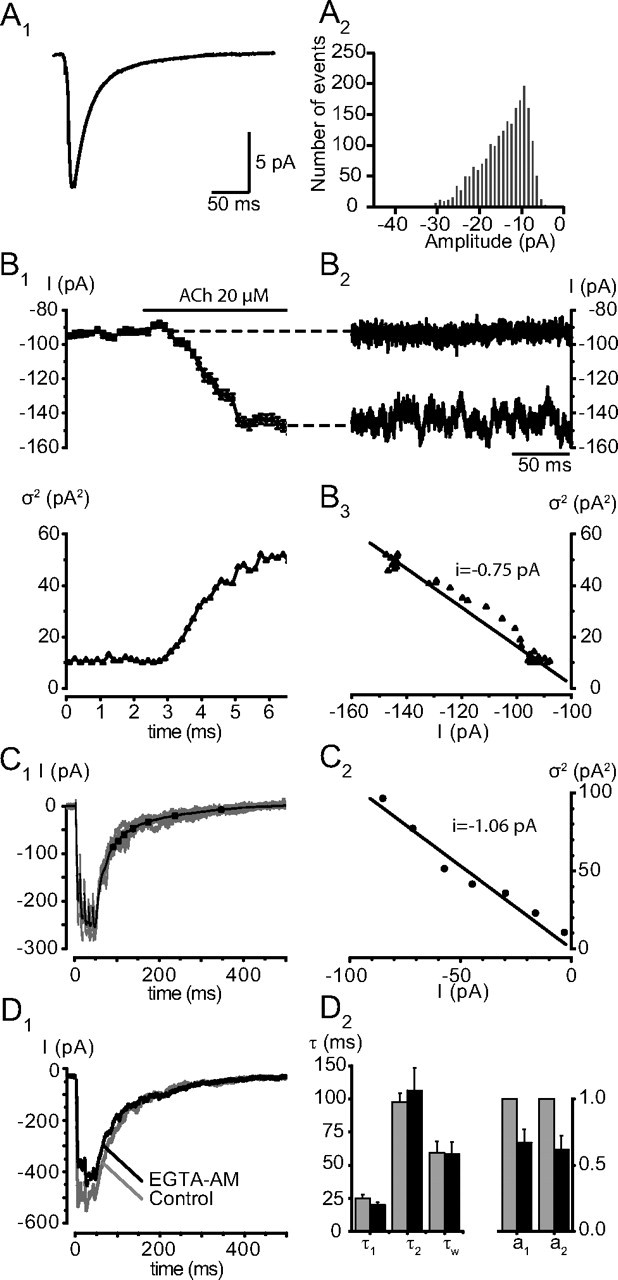
The slow component is not due to delayed release. A, Elementary fast decaying mEPSCs. A1, Averages of 2151 mEPSCs recorded after addition of TTX (500 nm). The amplitude of the average was −11.2 pA. The mean value for 5 experiments was −14.4 ± 2.1 pA. The decay of the mEPSCs was fit with a single exponential having a time constant of 14.1 ms. The mean value for 5 experiments was 13.0 ± 1.1 ms. The 20–80% rise time was 1.7 ms (mean value 1.5 ± 0.2 ms) A2, Distribution of the amplitudes of the mEPSCs. The threshold amplitude used to detect the events was set at −5 pA. B, Noise analysis of the current induced by an application of ACh (20 μm). B1, Top, Mean holding current (each dot corresponds to the mean value over an interval of 200 ms). Bottom, Variance of the current illustrated in the upper left, calculated for each 200 ms sample. B2, B3, Two records of 200 ms long of the holding current before ACh application (B2) and during the maximal effect of ACh (B3) illustrate the increase in noise. In this cell, the variance over current relation has a slope of − 0.75 pA, the mean value for this estimation of the unitary cholinergic current was −1.0 ± 0.1 pA (n = 4). C, Variance to mean ratio of the tail of eEPSCs. C1, Superimposed records of 5 EPSCs evoked by a 5-p train and average current of 59 records. The variance to mean analysis was performed only on the segment of the record starting 100 ms after the peak of the response to avoid a significant contribution of the fast component of the decay. The decay of the average synaptic current was subdivided into 7 steps of variable duration corresponding to a decrease of 5% of the maximal current amplitude (see Materials and Methods). The steps are marked by the dots on the segment. C2, Plot of the variance measured for the 7 segments over the average current during this segment. The leak current had been subtracted from the records. In this cell, the variance over current relation has a slope of − 1.06 pA. The average value of the elementary current measured during the decay of the 5p EPSCs was −1.1 ± 0.1 pA (n = 5). D, EGTA-AM reduces synaptic release but does not affect the decay of the synaptic current. EGTA-AM was applied at a concentration of 100 μm and produced a progressive decrease of the EPSCs. The decrease affected both components of the decay similarly. D1, Single 5p-EPSCs recorded before and 26 min after the application of EGTA-AM. D2, Bar graphs illustrating the mean changes of the EPSCs after 40 min in EGTA-AM. Amplitudes and time constants of decay were measured on averages from 10 records. The amplitudes of both components of the decay (normalized to the value before EGTA-AM) decreased, but there was no significant change in the time constants of the decay: control τ1(5p) = 24.7 ± 3.1 ms, τ2(5p) = 97.3 ± 7.0 ms, τw(5p) = 59.4 ± 8.6 ms; EGTA τ1(5p) = 20.2 ± 2.1 ms, EGTA τ2(5p) = 106.3 ± 17.1 ms; EGTA τw(5p) = 58.2 ± 9.3 ms (n = 3). The amplitudes a1 and a2 were reduced in EGTA to 67.1 ± 0.1 and 61.8 ± 0.1% of their original values.