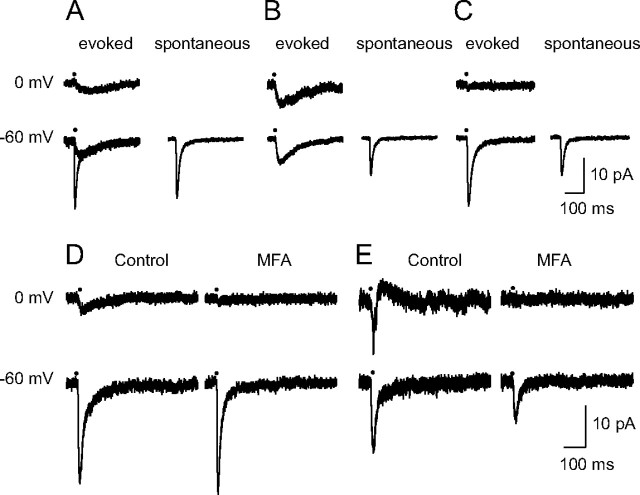
Figure 6.
EPSCs evoked by minimal stimulation. The eEPSCs induced by a “minimal stimulation”—analyzed at −60 and 0 mV—are presented for 5 different cells. A–C, Illustrate the difference between the decay of the eEPSCs and that of sEPSCs in three different cases. D, E, Illustrate the effects of MFA (50 μm). A, Mixed eEPSCs. At −60 mV the eEPSC alternated between small responses with a slow rise and a slow decay (in 24/85 cases), or responses with a fast rise and a biphasic decay (in 61/85 cases). At 0 mV, all eEPSCs had a slow decay. All sEPSCs (132) had a fast decay. B, Slow eEPSCs. The eEPSCs (left column) had a slow rise and a slow decay both at −60 and at 0 mV. Their amplitude was nearly identical at −60 and at 0 mV, suggesting that they were originating in a neighboring coupled RC. In contrast, the sEPSCs recorded at −60 mV (right) had a fast decay. C, Fast eEPSCs. At −60 mV the decay of the eEPSCs (left) and of the sEPSCs (right) were both fast. The eEPSC at 0 mV was very small, suggesting that there was no significant contribution from neighboring RCs. D, E, At −60 mV the eEPSCs had a biphasic decay. At 0 mV the response showed only a slow component (D) or a spikelet (E). MFA (1 h in D, 2 h in E) eliminated the responses at 0mV, and accelerated the decay of the responses observed at −60 mV. All traces are averages (10–61 events for eEPSCs, and of 72–132 events for sEPSCs). No sEPSC was detected at 0 mV (data not shown).

