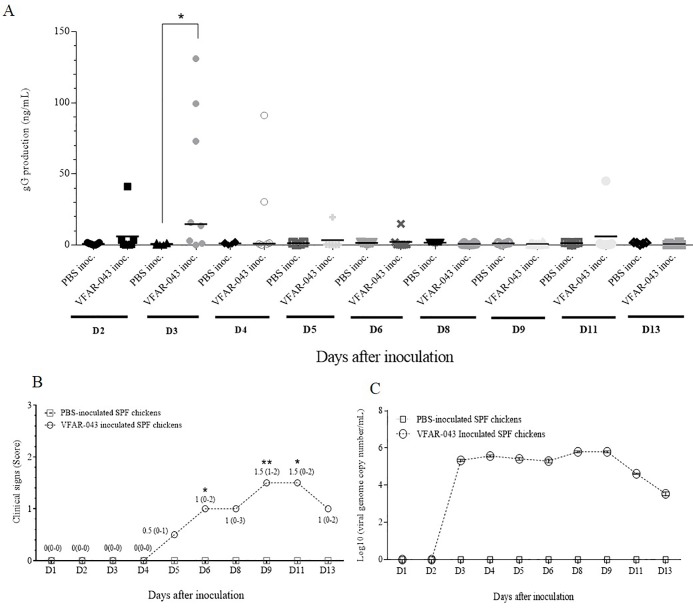
Fig 8.
Relationship among the gG production profile in tracheas (A), the clinical sign scores (B) and viral genome copy number in tracheas (C) from VFAR-043 inoculated SPF chickens. PBS inoc.: PBS-inoculated SPF chickens; VFAR-043 inoc.: VFAR-043 inoculated SPF chickens. (A): the horizontal lines indicate the median value for each group. (B): only numerical values for medians and ranges are shown for VFAR-043 inoculated SPF chicken and all medians for PBS-inoculated SPF chickens were zero. (C): Each point represents daily sample pooling for each group. All values were expressed as a log10 (viral genome copy numbers/mL). The Mann–Whitney U test was performed for analyses. * = p<0.05; ** = p<0.005.

