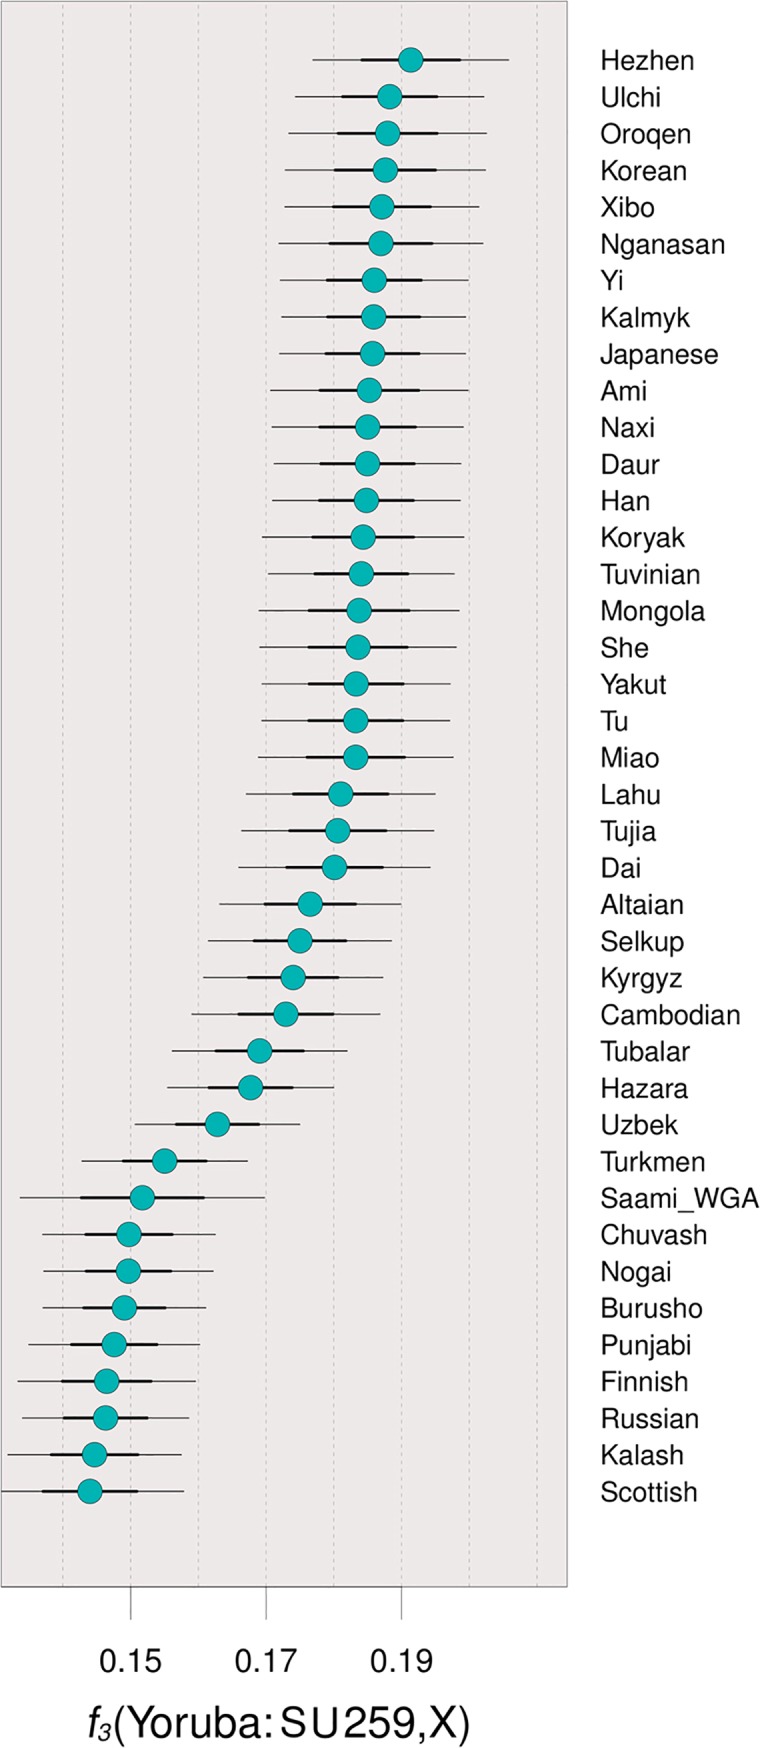
Fig 4. Outgroup-f3 results for individual SU 259 with thick and thin bars representing 1 and 2 standard deviations, respectively.

The results show this individual shares higher affinities with East Asian than with West Eurasian, even when the standard deviations are considered.
