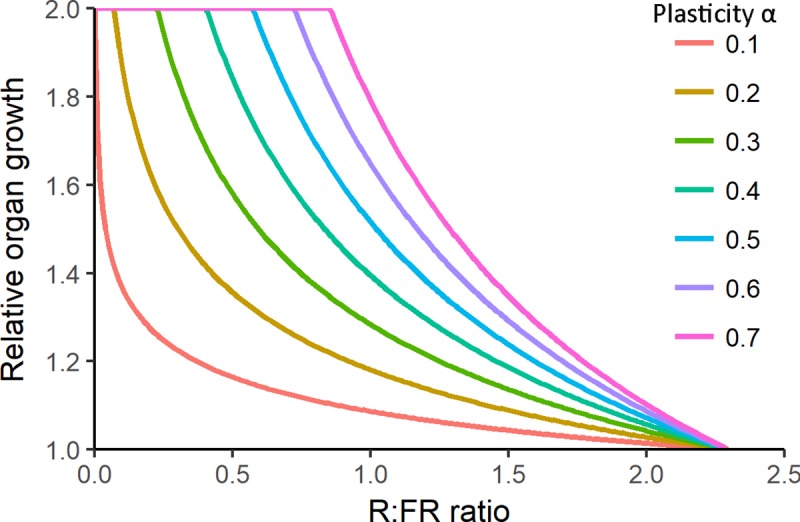
Fig 1. Visualization of different plasticity strategies.

Plasticity strategies are presented with different values of α, and illustrate different shapes of the curve describing the relative organ response at various R:FR values (see Eq 1 in Methods). Different plasticity strategies tested within this study are created by increasing the value α from 0 to 0.7 with steps of 0.1 (see legend). Petiole and lamina responses are simulated by multiplying the organ (or organ growth) with this relative response value (see Methods for details). Plasticity strategy with α = 0 is a horizontal line at 1 (not visible in the graph) and indicates no plastic response to R:FR because a relative value of 1 does not change the organ size of growth rate. As the plasticity strategy α increases, strategies are referred to as being more sensitive to R:FR decrease.
