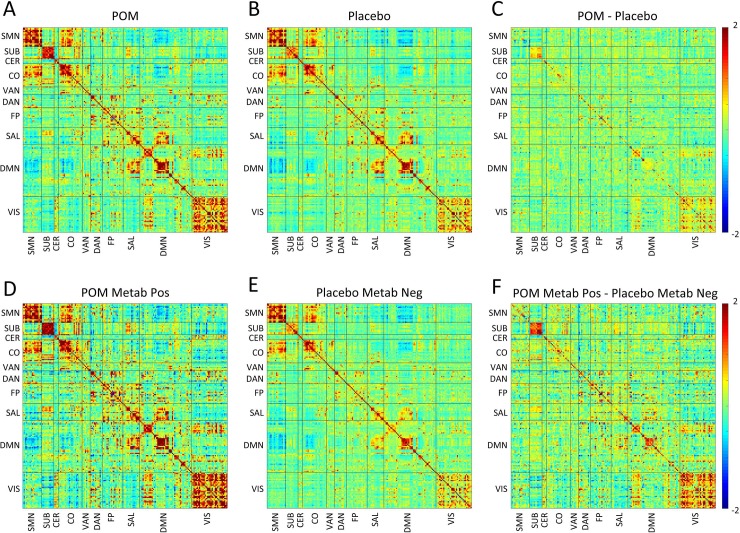
Fig 4. Relationships between maternal pomegranate juice intake and infant fcMRI measures (covariance).
Group mean covariance matrices are shown representing all ROI pairs. The block structure along the diagonal seen in both groups corresponds to resting state networks. Warm hues within diagonal blocks reflect positively correlated ROIs within RSN, while cool hues reflect negatively correlated ROIs within RSNs. (Top, A-C) Treatment vs. placebo (modified intention-to-treat analysis). (A) Infants in treatment (pomegranate juice) group and (B) infants in placebo group at term-equivalent. (C) Shows the difference between groups (treatment minus placebo). Note treatment > placebo covariance within subcortical and visual networks. (Bottom, D-F) Metabolite-positive treatment vs. metabolite-negative placebo (per-protocol analysis). (D) Infants in metabolite-positive treatment group and (E) infants in metabolite-negative placebo group at term-equivalent. (F) Shows the difference between groups (metabolite-positive treatment minus metabolite-negative placebo). Note metabolite-positive treatment > metabolite-negative placebo covariance within subcortical and visual networks. CER—cerebellar; CO—cingulo-opercular; DAN–dorsal attention network; DMN–default mode network; FP–frontal parietal network; LAN–language area network; Metab–metabolite; Neg–negative; POM–pomegranate; Pos–positive; SAL–salience network; SMN–sensorimotor network; SUB–subcortical grey matter; VAN–ventral attention network; VIS–visual network.

