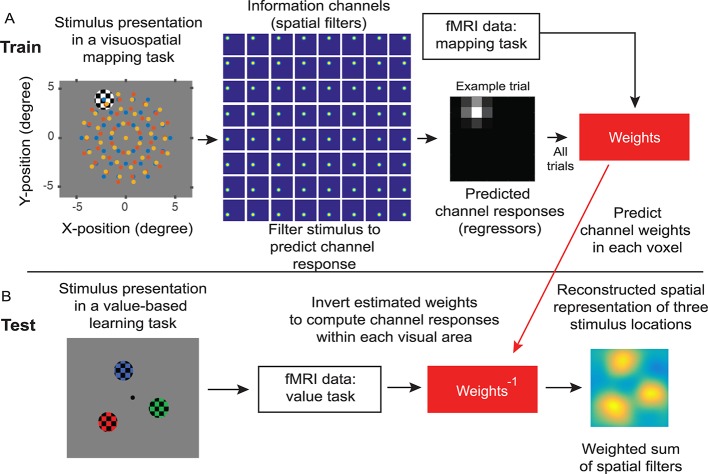
Fig 3. Quantifying stimulus representations with an IEM.
(A) The IEM was trained using fMRI data from the visuospatial mapping task, in which flickering-checkerboard mapping stimuli were randomly presented at each of 111 locations (center locations shown in blue, red, and yellow dots in the first panels; these dots were not physically presented to participants). We filtered individual stimulus locations using 64 Gaussian-like spatial filters to predict channel responses for each trial. We then use the predicted channel responses and fMRI data of all trials to predict channel weights for each voxel within each visual area. (B) The IEM was tested using fMRI data from the value-based learning task (an independent data set). We inverted the estimated channel weights to compute channel responses within each visual area, resulting in a spatial reconstruction centered at 3 stimulus locations in the value-based learning task. fMRI, functional magnetic resonance imaging; IEM, inverted encoding model.

