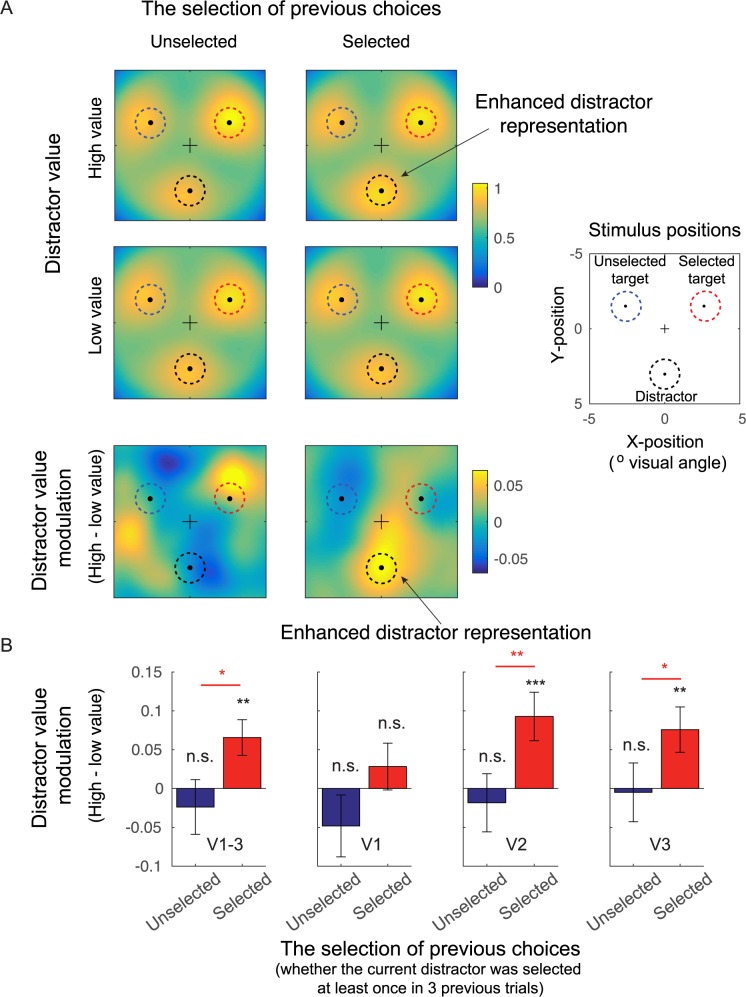
Fig 4. Distractor value boosted the activation of distractor representations in early visual cortex.
(A) Averaged spatial reconstructions of the selected target, unselected target, and distractor based on fMRI activation patterns in early visual areas (collapsed across V1–V3). The data were sorted based on the distractor value (high and low distractor value) and the selection of previous choices (whether the current distractor was previously selected at least once in 3 prior trials: selected and unselected; also see Materials and methods). Before averaging, reconstructions were rotated so that the positions of each respective stimulus type were in register across subjects. In each color plot, a black dot marks the location of the central fixation, and 3 surrounding dots at 30°, 150°, and 270° polar angle indicate the centers of the selected target, unselected target, and distractor locations, respectively. The bottom panels show difference plots between high- and low-distractor-value conditions. (B) The distractor-value modulation (high − low distractor value) from the reconstruction activation (averaged across black dashed circles in [A]). Overall, we found significant distractor-value modulations in extrastriate visual areas V2 and V3, only in trials in which the current distractor was previously selected. Black ** and *** show significant distractor-value modulations compared to 0 with p < 0.01 and p < 0.001 (2-tailed). Red * and ** show a significant difference between trials in which the current distractors were previously selected and unselected with p < 0.05 and p < 0.01 (1-tailed). The statistics computed for different visual areas were corrected using the Holm-Bonferroni method. All error bars show ± 1 SEM. Blue, red, and black dashed circles in (A) represent the spatial extents of unselected targets, selected targets, and distractors, respectively. fMRI, functional magnetic resonance imaging; n.s., no significant difference.

