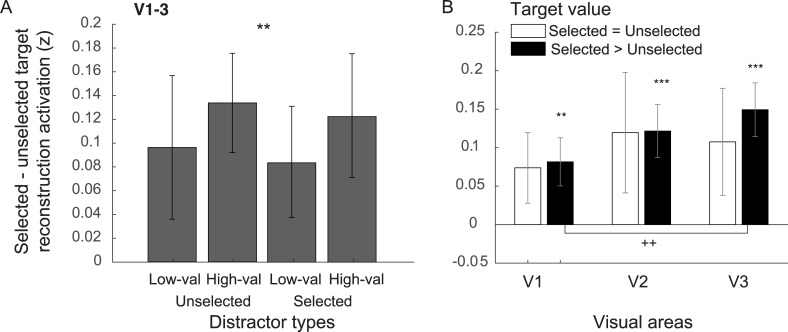
Fig 5. Target-selection modulations in early visual areas.
(A) The difference between the selected and unselected target reconstruction activation for different target types. The activation values were obtained from averaging the reconstruction activation over circular spaces spanning the spatial extents of target stimuli (red and blue dashed circles in Fig 4A). The data in (A) were collapsed across visual areas. (B) The same data as (A) but plotted separately for different target-value conditions and for different visual areas. ** and *** indicate significant target-selection modulations compared to 0 with p < 0.01 and < 0.001, respectively (2-tailed). ++Significant difference across visual areas V1 and V3. Statistics in (B) were corrected for multiple comparisons with the Holm-Bonferroni method. All subfigures are plotted with ±1 SEM. val, valued.

