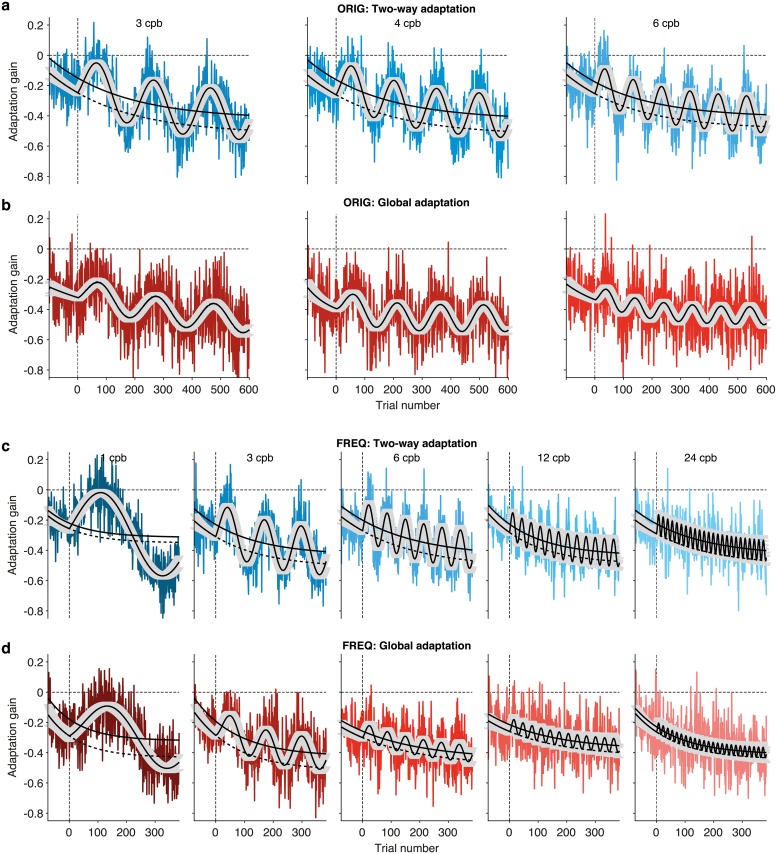
Fig 1. Fits of the phenomenological model to the experimental data.
The plots show adaptation gain (colored lines) averaged over individuals in the (a) Two-way adaptation and (b) Global adaptation condition of the ORIG data set (reported in [11]), as well as the (c) Two-way adaptation and (d) Global adaptation condition of the FREQ data set, using the same paradigm over an extended range of frequencies. The fit (black line) is based on Eq 6. The same equation was fitted to data from each participant in each condition and experiment, to estimate phenomenological parameters on an individual basis. For illustration purposes only, the figure depicts fittings done over the averages along with 95% confidence intervals (gray shaded areas). The black dotted lines indicate the time evolution of the baseline if the amplitude of the periodic response were zero, corresponding to a drift only model. The solid black lines indicate the approximate middle-point locations of the periodic component.

