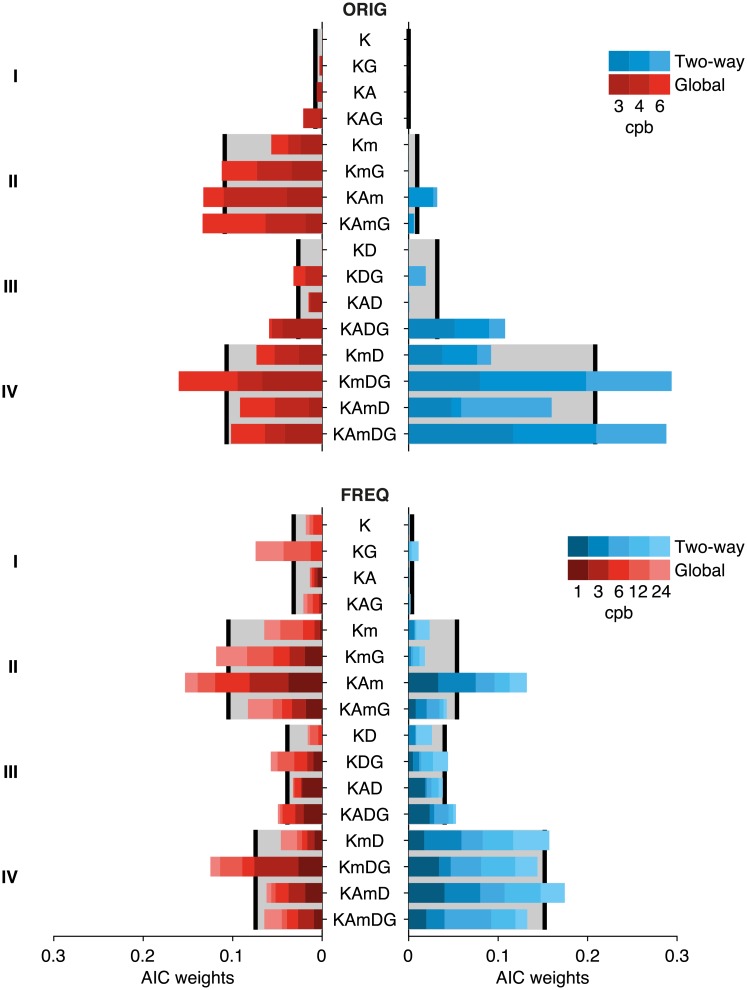
Fig 5. Akaike weights [40] for the 16 versions of the generative model, segregated by condition (frequency and type of adaptation).
The label along the middle y-axis indicates the model for the weight displayed in the horizontal bars. Results from dataset ORIG (a) and FREQ (b). Weights for each of the three frequencies for each type of adaptation (blue tones for Two-way expanding to the right, red tones for Global to the left) are stacked for each model and color-coded as in Fig 1. The models are grouped according to the criterion described in the subsection Rationale for generative model building and parameter exploration in the Discussion section (see text for further details). Gray areas in the background indicate the average weight of the corresponding model group.

