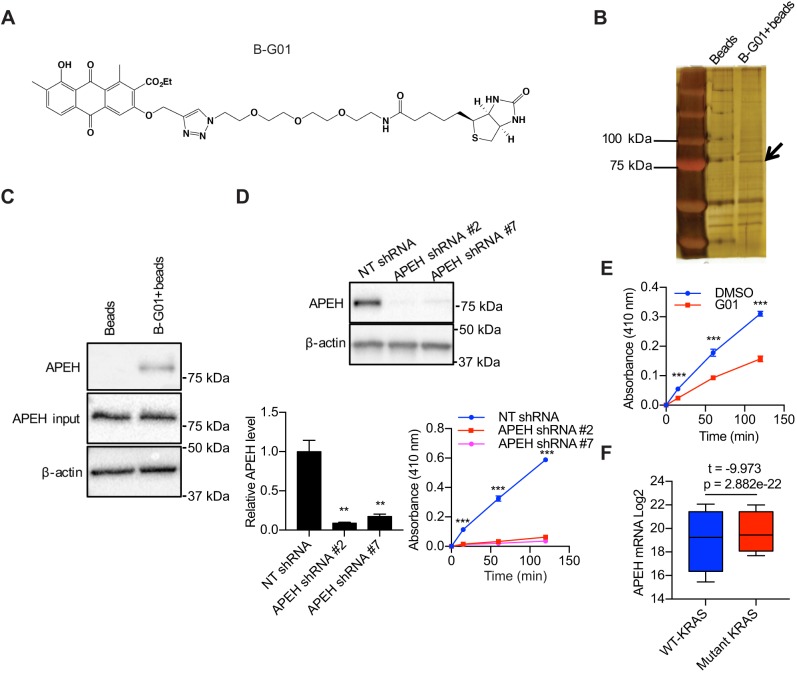
Fig. 1.
APEH is bound and inhibited by G01. (A) Structure of B-G01. (B) Beads collected from cell lysates incubated with or without B-G01 were analyzed by silver staining. The band that was analyzed by mass spectrometry is indicated (arrow). (C) Beads collected from 200 μg cell lysates incubated with or without B-G01 were immunoblotted for APEH. Controls including 20 μg whole-cell lysate (input) were immunoblotted for APEH and β-actin. Representative blots were shown. (D) Lysates of MDCK cells transfected with NT shRNA or APEH shRNAs were blotted for APEH. The level of APEH was normalized to the level of β-actin. Representative western blots are shown. **P<0.01 between APEH knockdown and control APEH levels (one-way ANOVA). Lysates were incubated with 1 mM ac-Ala-pNA for 2 h at 37°C. Absorbance at 410 nm was measured at intervals. ***P<0.001 (one-way ANOVA). Results are mean±s.e.m. (n=3). (E) MDCK cell lysates were incubated with vehicle (DMSO) or 50 μM G01 for 1 h at room temperature and 1 mM ac-Ala-pNA was added. Absorbance at 410 nm was measured following warming to 37°C. Results are mean±s.e.m. (n=3). ***P<0.001 between DMSO- and G01-treated background-subtracted absorbance (Student's t-tests). (F) Box plots indicating quartiles of APEH expression level in patient tissues (n=20,163) of 33 types of cancers with or without KRAS mutants were generated using the UCSC Xena Browser. Whiskers represent upper and lower quartiles. The statistical significance was analyzed with Welch's t-test.

