Fig. 5.
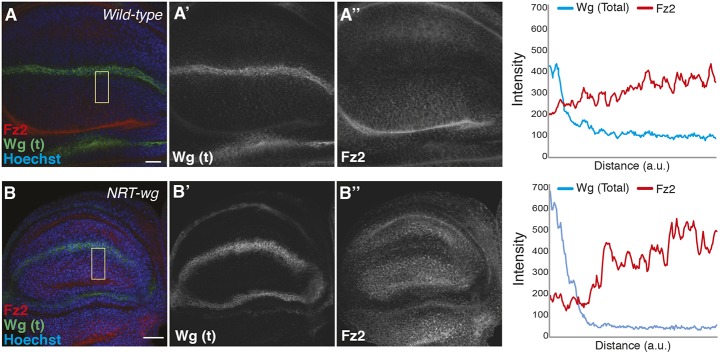
Fz2 levels are increased in cells beyond the reach of NRT-Wg. (A-B″) Representative images of Fz2 and Wg staining on either wild-type (A-A″) or NRT-wg homozygous (B-B″) discs imaged with the same confocal settings. Graphs on the right show intensity profiles across the yellow boxes in A and B. a.u., arbitrary unit. Scale bars: 20 μm.

