Fig. 7.
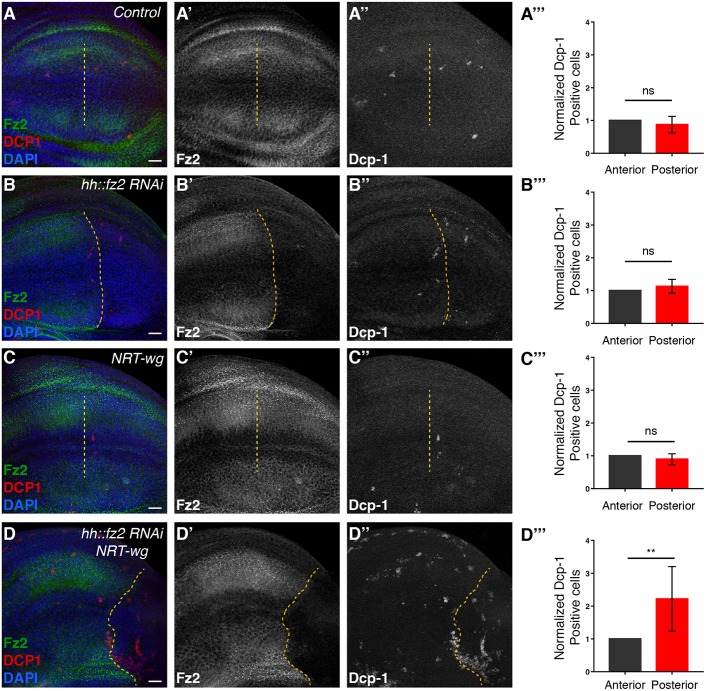
Depletion of Fz2 leads to higher cell death in NRT-wg discs. (A-A″) Fz2 and Dcp-1 (cell death marker) expression in control wing imaginal disc (n=8). Yellow dotted line separates anterior (left) and posterior (right) compartments, identified by the anterior zone of non-proliferating cells (ZNC). (B-B″) Fz2 and Dcp-1 expression upon fz2 knockdown in the posterior compartment with hh-Gal4; Dcp-1 levels remain unaffected (n=11). Anterior and posterior compartments are marked by Fz2 levels. (C-C″) Fz2 and Dcp-1 expression in NRT-wg (n=8). Anterior-posterior compartments are marked by the anterior ZNC. (D-D″) Fz2 and Dcp-1 expression upon fz2 knockdown in the posterior compartment of NRT-wg discs; Dcp-1 levels are increased in the posterior region (n=8, P=0.0036). Anterior and posterior compartments are marked by Fz2 levels. (A″′-D″′) The graphs represent normalized Dcp-1-positive cells in the posterior compartment compared with the anterior compartment for the respective genotypes. Unpaired Student's t-test was applied for statistical analysis. ns, not significant; **P<0.01. Scale bars: 20 μm.

