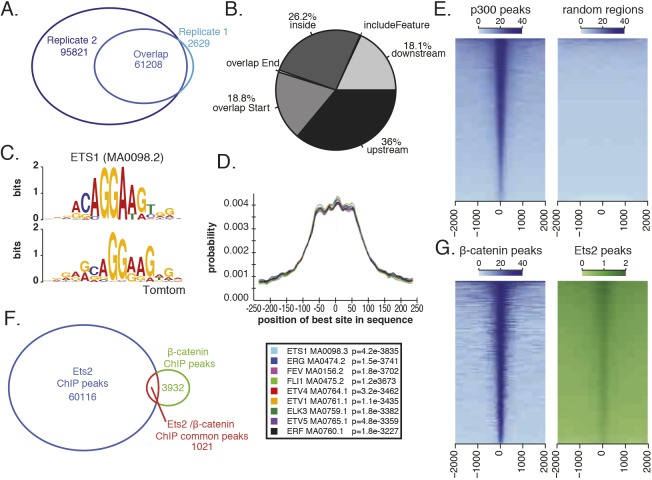
Fig. 2.
ChIP-seq of a FLAG-tagged Ets2 at mid gastrula identifies Ets2-bound regions. (A) Number of Ets2 ChIP peaks identified by MACS2 in each replicate and the overlap. (B) Percentage of peak overlap with indicated genomic features. (C) Using MEME-ChIP, Ets1 (MA0098.2) motif is identified as enriched in Ets2 ChIP-seq peaks. Top is the Ets1 motif and bottom is the enriched motif from the ChIP-seq peaks. (D) Graph generated by CentriMo showing the probability of finding a given motif in the Ets2 peak region. Ets family transcription factors that were centrally enriched are shown (below). (E) Heatmaps of Ets2 ChIP-seq coverage on p300 peaks compared with random regions. (F) Overlap of Ets2 ChIP peaks and β-catenin ChIP peaks. Both sets of data were analyzed using MACS2 and ChIPpeakAnno R package. (G) Heatmap of Ets2 coverage on β-catenin peaks and β-catenin coverage on Ets2 peaks.

