Fig. 3.
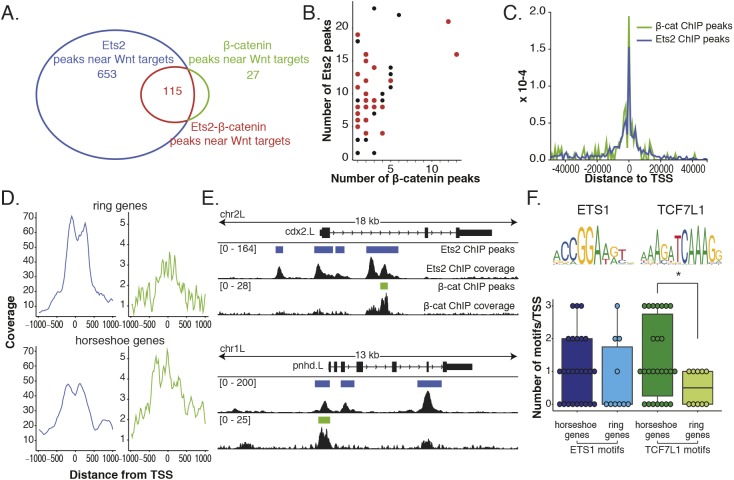
Differential overlap of Ets2 and β-catenin ChIP data at the promoters of Wnt target genes. (A) Overlap (115) of Ets2 and β-catenin subsets of peaks near previously identified Wnt target genes. (B) Number of Ets2 and β-catenin peaks near individual Wnt target genes. Genes in red are the targets that have in situ hybridization patterns described here. Genes in black are without described expression patterns. (C) Histogram of distance to TSS of both Ets2 and β-catenin ChIP peaks using subset of peaks near Wnt target genes. (D) Wnt target genes were first separated based on having either a ring or horseshoe expression pattern. Then the coverage at ±1 kb from the TSS of each gene was calculated and plotted for both Ets2 (blue) and β-catenin (green) ChIP. (E) Genome-browser view of Ets and β-catenin coverage around TSS of a ring gene (cdx2) and a horseshoe gene (pnhd). (F) Number of Ets or TCF7L1 (TCF3) motifs around TSS for horseshoe or ring genes. P-value of 0.38 between horseshoe and ring genes for Ets motif and 0.042 for TCF3 motif (*) calculated using Wilcoxon rank sum test. Data are mean±s.d. with individual data points indicated.

