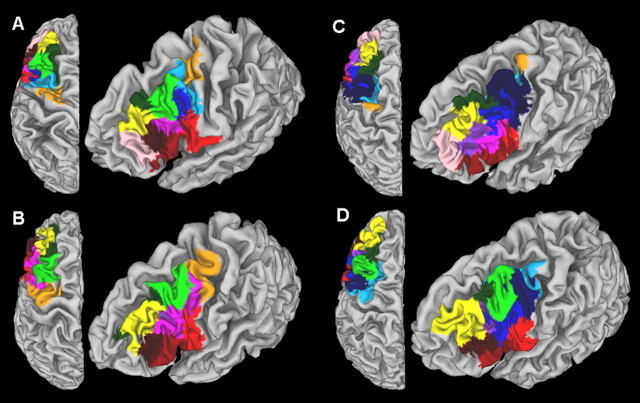
Figure 3.
A–D, Parcellation results obtained for four subjects. Each module map is overlaid on the individual anatomy of each subject displayed in a lateral and a dorsal view. Each module has a unique color. Modules that are part of the same cluster of modules are the same color (see Fig. 5). This color coding is followed throughout the paper. Note the similar layout of the modules across the subjects and the variability in the exact shape and extent of modules that belong to the same cluster of modules. Modules that are not in a “group representative” cluster of modules are dark (navy) blue (see Materials and Methods and Results).

