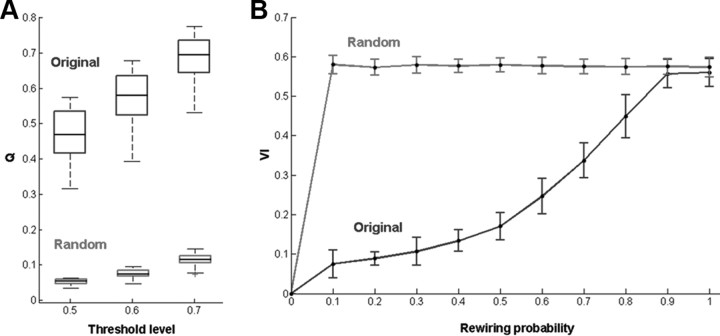
Figure 4.
A, Modularity Q obtained at different threshold values for the original and equivalent random graphs. The box plots depict the median along with the 25th and 75th percentiles of the values. Whiskers represent minimum and maximum values, and crosses represent values marked as outliers. B, Variation of information between the parcellations obtained from the unperturbed and the increasingly perturbed graph, for the original and equivalent random graphs. Error bars represent SD. Depicted values are across subjects (see Materials and Methods and Results).

