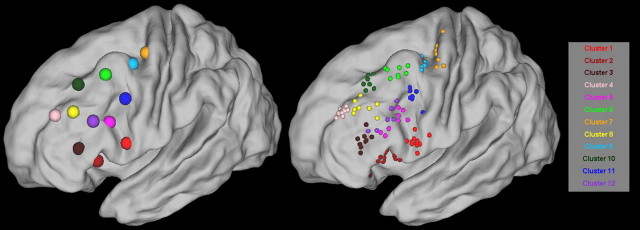
Figure 5.
Large spheres represent the COM of the 12 clusters of modules. The COM of these clusters is the mean of the COM of the modules that constitute each cluster. Small spheres represent the COM of the modules of each cluster detected for each subject (see also Fig. 3). Only group representative clusters are depicted that contain modules from at least 7 of 12 subjects. Each sphere has a unique color, and the COM of modules belonging to the same cluster are the same color.

