Figure 6.
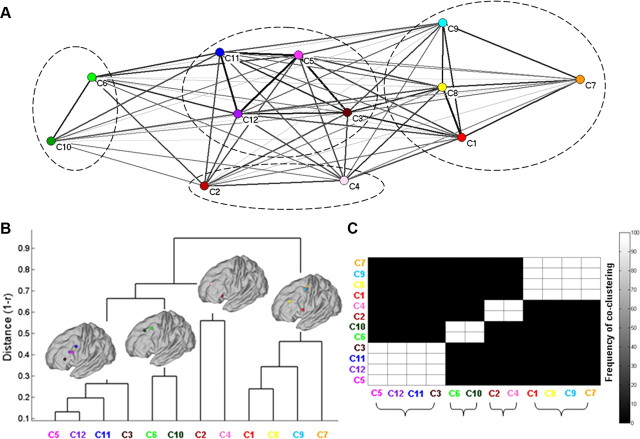
A, Representation of the raw similarity of the whole-brain FC among the traced clusters of modules. Clusters are arranged in space by using the Kamada–Kawai spring-embedding algorithm, based on the similarity of their whole-brain FC. Thick (thin) lines indicate high (low) similarity, and circles delineate the families traced with hierarchical and k-means clustering. B, Dendrogram representing the similarity of the whole-brain FC of the cluster of modules. Each brain depicts the COM of the clusters of modules that form a family (i.e., have similar whole-brain FC). A set of clusters of modules formed a family if the “intrafamily” distance was less than the 70% of the largest distance in the dendrogram. C, Clusters of modules grouped according to their whole-brain FC similarity with the k-means algorithm. Brackets denote the grouping of the clusters of modules to families. The frequency of the co-clustering matrix indicates the high stability of the families across 1000 k-means solutions (see Materials and Methods and Results for details). The color coding for each cluster of modules follows that of Figure 5.

