
Figure 7.
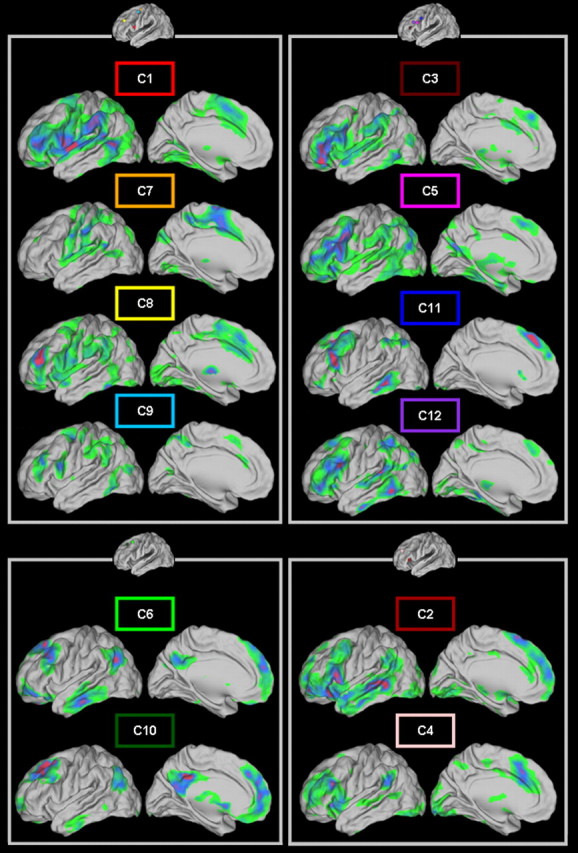
Whole-brain FC of the 12 clusters of modules grouped according to the four LFC families. Clusters are grouped according to the LFC family to which they belong (see Fig. 6) following the color coding of Figure 5. Darker (violet/red) regions represent higher t values. All maps are thresholded at q < 0.05 (FDR level). Note the FC similarities (or dissimilarities) among clusters of modules that belong to the same (or different) family. For the computation of these second level maps, different ROIs derived from the parcellation obtained from each subject were used (see Materials and Methods).