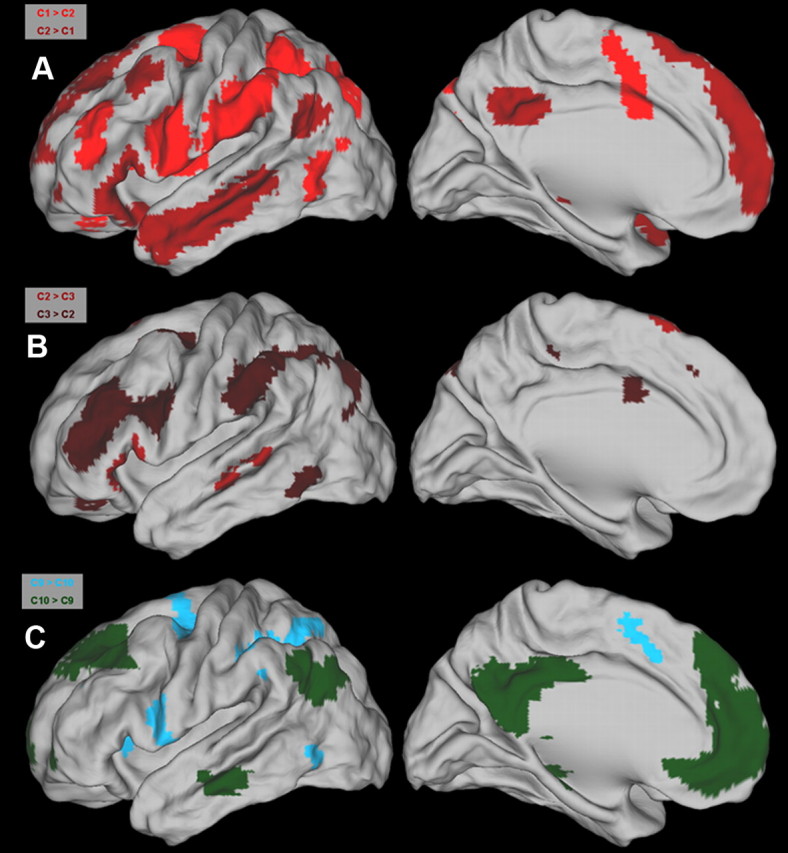
Figure 8.

A–C, Direct comparisons through t tests reveal significant differences in the whole-brain FC of clusters located at the ventral (A, B) and dorsal (C) parts of the LFC. Significant differences associated with a particular cluster follow the color coding in Figure 5. Maps depict regions that are significant at q < 0.05 (FDR level).
