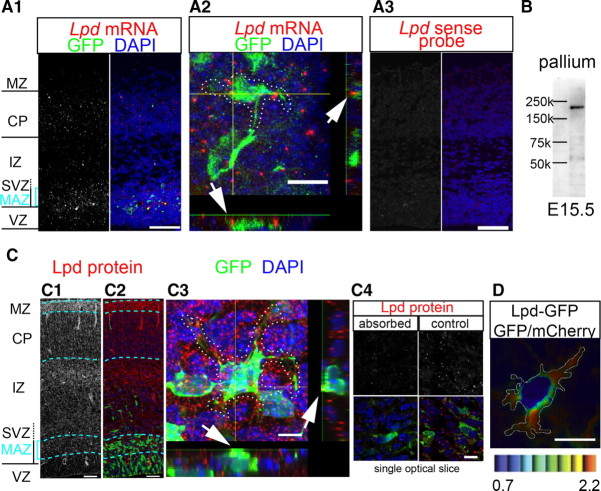
Figure 2.
Lpd is expressed in multipolar cells at both the mRNA and protein level. A1–A3, Fluorescent in situ hybridization of Lpd. To visualize the multipolar cells, the brains were electroporated with EGFP/pCAGGS at E15.0 and fixed at E16.5. A1, Lpd mRNA expression was detected mainly in the MAZ and CP. A2, A higher magnification shows that the multipolar cells (enclosed by a dotted line) express Lpd. A z-axis reconstruction of the signals along the x-axis and y-axis is shown at the bottom and right side, respectively. Scale bar, 10 μm. A3, Fluorescent in situ hybridization with an Lpd sense probe. The image was obtained under the same conditions as A1. B, A Western blot analysis of Lpd in extracts of mouse E15.5 pallium using a polyclonal Lpd antibody revealed a single band at ∼200 kDa. C1–C4, Immunohistochemistry of Lpd. C1, C2, To visualize the multipolar cells, the brains were electroporated with EGFP/CAGGS at E15.0 and fixed at E16.5. The cell nuclei were stained with DAPI. Scale bar, 50 μm. C3, x–z and y–z planes as well as the Z-projection of the image stacks are shown to illustrate the colocalization of GFP and Lpd. A higher magnification shows that Lpd is expressed in multipolar cells (enclosed by a dotted line). Scale bar, 5 μm. C4, Preabsorption of the antibody with the epitope–GST fusion peptides (absorbed, left) reduced the immunohistochemistry signals (control, right). The top panels show the immunohistochemistry signals, and the bottom panels show the merged images with GFP (green) and nuclear (DAPI, blue) staining. Scale bar, 10 μm. D, Representative ratio image of a multipolar cell in the MAZ transfected with Lpd–GFP and mCherry. Eight colors from red to blue are used to represent the GFP/mCherry ratio from 0.7 to 2.2. The upper and lower limits of the ratio range are shown. Scale bar, 10 μm.

