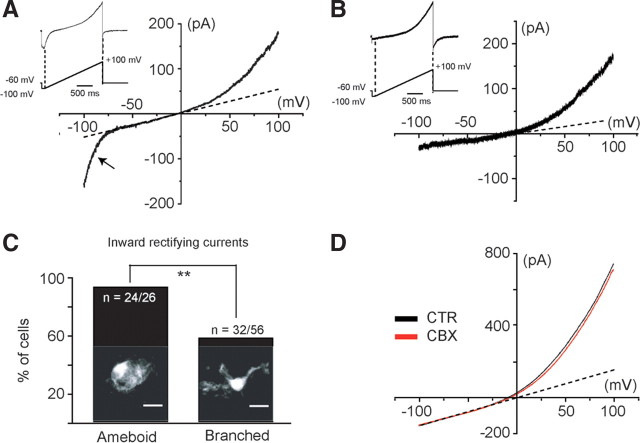
Figure 2.
Voltage-activated current profile in microglia of the developing SC. Voltage-activated current was analyzed using voltage ramps ranging from −100 to +100 mV over 2 s. Two different voltage-activated current patterns could be distinguished: an IrC, observed at membrane potentials lower than ≈−70 mV (A), and an OrC (B). C, The absence or the presence of IrC was significantly correlated (p < 0.05) to the morphology of the recorded microglia (Fisher's exact test, p < 0.05). Confocal images (Z-stack) showing amoeboid microglia (left) and branched microglia (right) in the ventral SC area of CXCR1 EGFP mice. D, The gap junction/hemichannel blocker CBX (100 μm) had no effect on the OrC (p > 0.1). This current was 8.4 ± 4.8% inhibited in the presence of 100 μm CBX (N = 8). CTR, Control.

