
Figure 11.
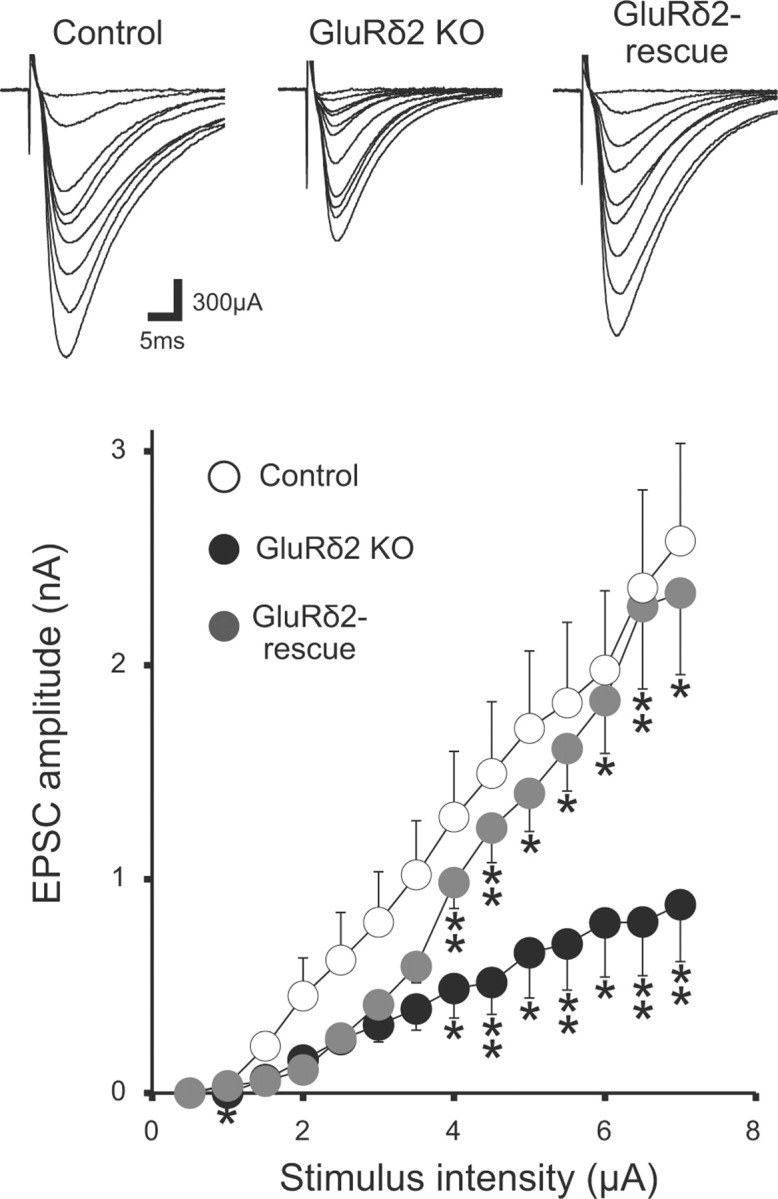
PF–PC synapses in chimera cocultures using GluRδ2 knock-out mice. Representative traces of PF-EPSCs with increasing stimulus intensities (top) and averaged input–output relations of PF-EPSCs (bottom) in control (13 PCs from 5 slices), GluRδ2 KO (12 PCs from 5 slices), and the GluRδ2 rescue (11 PCs from 4 slices) cocultures. The holding potential was −80 mV. Asterisks in GluRδ2 KO and GluRδ2 rescue indicate significant differences when compared with control and GluRδ2 KO, respectively (*p < 0.05; **p < 0.01; Steel–Dwass test).