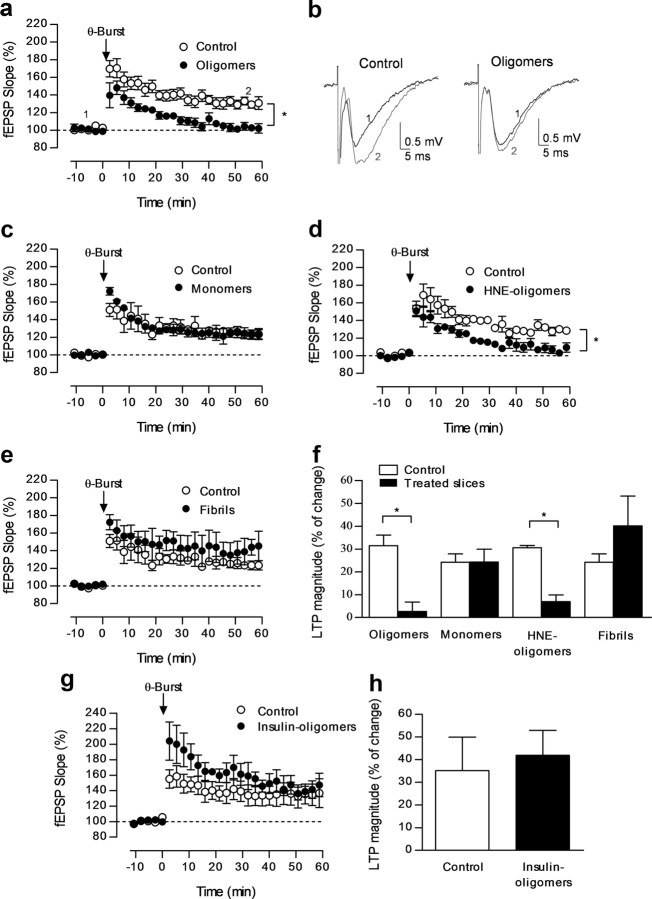
Figure 2.
a-syn oligomeric species impair LTP. a, Changes of fEPSP slope induced by theta-burst stimulation in control slices (○, n = 6) and in slices pre-incubated with a-syn oligomeric species (●, n = 6, 500 nm; 90 min). b, Traces from representative experiments obtained before (1) and 46–60 min after (2) LTP induction, composed of the stimulus artifact followed by the presynaptic volley and the fEPSP. c, Changes in fEPSP slope induced by theta-burst stimulation in control slices (○, n = 3) and in slices pre-incubated with a-syn monomeric species (●, n = 3, 500 nm; 90 min). d, Changes of fEPSP slope induced by theta-burst stimulation in control slices (○, n = 3) and in slices pre-incubated with a-syn HNE-oligomers (●; n = 5) (500 nm; 90 min). e, Changes of fEPSP slope induced by theta-burst stimulation in control slices (○, n = 3) and in slices pre-incubated with a-syn fibrils (●, n = 3, 500 nm; 90 min). f, LTP magnitude (change in fEPSP slope at 46–60 min) induced by theta-burst stimulation in relation to pre-theta-burst values (100%) in control slices and those that had been pre-incubated with a-syn oligomeric species (500 nm; 90 min), a-syn monomers (500 nm; 90 min), and a-syn fibrils (500 nm; 90 min) as indicated below each column. All values are mean ± SEM. g, Changes of fEPSP slope induced by theta-burst stimulation in control slices (○, n = 3) and in slices pre-incubated with insulin oligomeric species (●, n = 3, 500 nm; 90 min). h, Plot of the LTP magnitude (change in fEPSP slope at 46–60 min) induced by theta-burst stimulation in relation to pre-theta-burst values (100%) from experiments shown in g as indicated below each column. All values are mean ± SEM.

