
Figure 4.
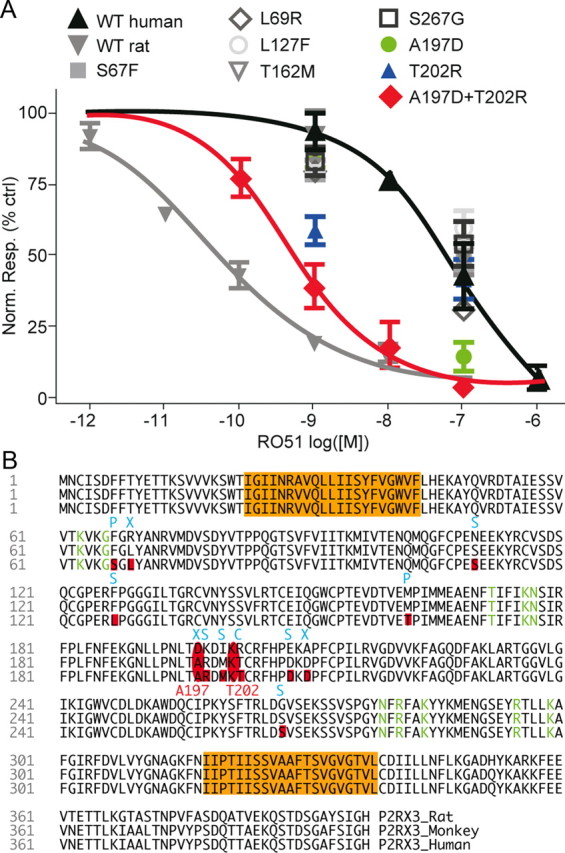
P2X3 structural determinants underlying species-dependent drop in RO51 potency. A, Concentration–response curve of RO51 on WT rat P2X3 (gray, Hill slope= −0.54), WT human P2X3 (black, Hill slope= −0.61), and mutants of human P2X3. A197D + T202R double mutant (red) increased the potency of RO51 on human P2X3 by 225-fold (Hill slope= −0.78). B, P2X3 protein sequence for rat, monkey, and human showing transmembrane domains (orange) and residues contributing to the agonist-binding site (green). Nonconserved residues between rat and human ectodomains are highlighted in red, resulting in a different charge (C), polarity (P), size (S), or charge and size (X).