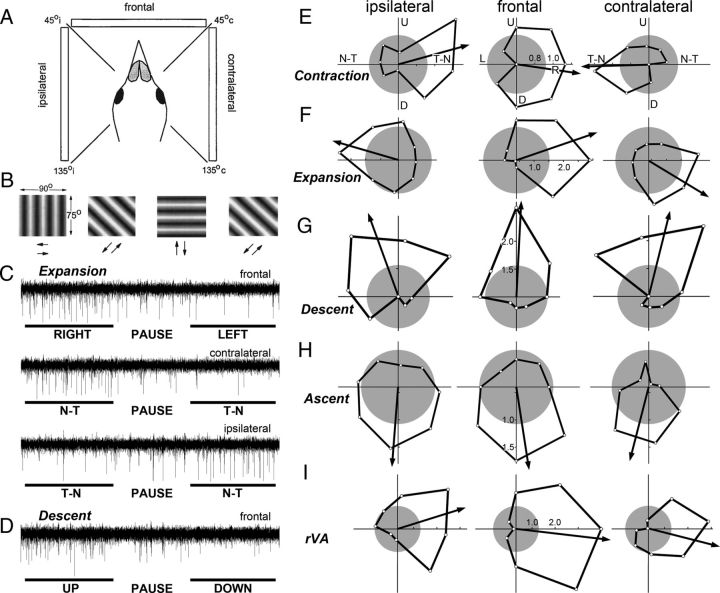
Figure 3.
CSA of Purkinje cells in the vestibulocerebellum in response to moving large-field stimuli presented in different regions of the visual field. A, The screen was positioned at one of three locations relative to the bird: the ipsilateral, contralateral, and frontal regions (assuming recordings were made in the left VbC). B shows the four grating orientations used to determine tuning curves in each location. Drifting sine and square wave gratings were backprojected onto the screen that measured 90 × 75° (width by height). Each grating moved in both directions, perpendicular to the orientation of the grating. Direction tuning curves were constructed by plotting the response as a function of the eight directions of motion (E–I). C shows a recording of the response of an expansion cell to a single sweep of horizontal motion in the frontal, contralateral, and ipsilateral fields. D shows the recording of a descent cell to a single sweep of vertical motion in the frontal field. Each sweep consisted of 5 s of motion in one direction, followed by a 4 s pause, and then 5 s of motion in the opposite direction. E–I show direction tuning curves of contraction (E), expansion (F), descent (G), ascent (H), and rVA (I) neurons for each of the three regions of the visual field (ipsilateral, frontal, contralateral). The tuning curves plot the firing rate as a function of direction of motion in polar coordinates. The gray circles represent the spontaneous rates, and the arrows indicate the preferred direction (i.e., the orientation of the mean vector). U, D, L, R, Upward, downward, leftward, and rightward motion. N-T, T-N, Nasal-to-temporal and temporal-to-nasal motion, respectively.

