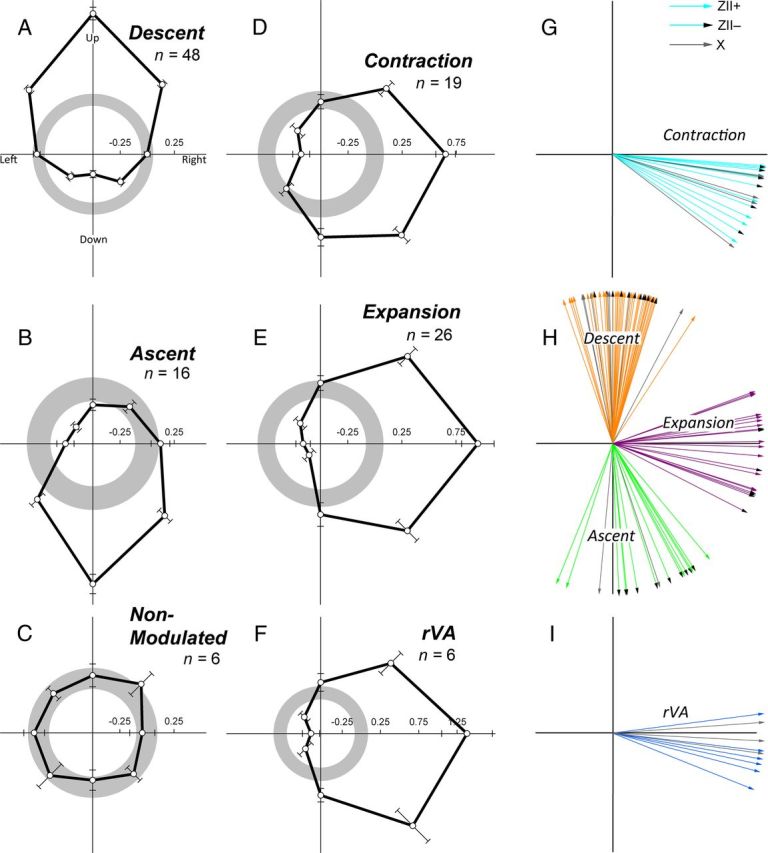
Figure 4.

Average direction tuning curves and preferred direction of visual motion of Purkinje cells in the ventral uvula and nodulus. A–F shows the average direction tuning curves, as measured in the frontal field, for all cell types encountered (descent, ascent, nonmodulated, contraction, expansion, rVA). These were averaged after subtracting the spontaneous rate (SR) from the firing rate in each direction from a given cell type. Average firing rate was plotted as a function of direction of motion in polar coordinates, and the error bars represent ±1 SEM. The gray circles indicate the average spontaneous rate (set to 0) ± 1 SEM. G–I show the distributions of the preferred directions of all contraction, expansion, descent, ascent, and rVA cells by calculating the mean vector (for details, see Materials and Methods). For each of G–I, an arrow indicates the preferred direction of individual cells in a ZII+ zone (solid, colored arrows), a ZII− zone (colored arrows with a black arrowhead), and folium X (solid, gray arrows).
