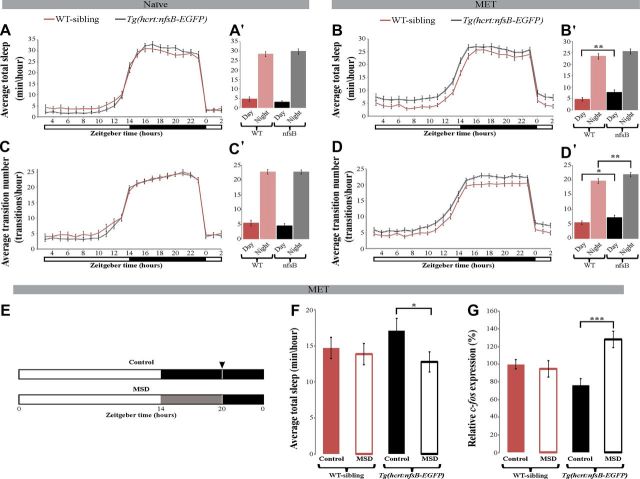
Figure 4.
Fragmented and increased sleep and sensitivity to mild sleep disturbance in HCRT neuron-ablated larvae. Recording of sleep was performed in 6 dpf larvae and lasted for 24 h under 14 h light/10 h dark cycle (white and black bars represent light and dark periods, respectively). In the absence of MET, both Tg(hcrt:nfsB-EGFP) and WT-siblings demonstrated similar sleep time during the day and night (n = 60 for each genotype, A). However, after MET treatment (B), HCRT neuron-ablated larvae (n = 122) slept more (p < 0.01, repeated-measures ANOVA) than WT-siblings (n = 118). The bar charts (A', B') represent the average sleep for total daytime or total nighttime for each genotype. Notably, in untreated larvae, the number of sleep/wake transitions per hour is rhythmic and similar in both Tg(hcrt:nfsB-EGFP) and WT-sibling (C). However, after MET treatment, the number of sleep/wake transitions per hour increased in HCRT neuron-ablated larvae during the day and the night (*p < 0.05, **p < 0.01, repeated-measures ANOVA; D). The bar charts (C', D') represent the average sleep/wake transitions for total daytime or total nighttime for each genotype. HCRT neuron-ablated (Tg(hcrt:nfsB-EGFP)+MET) and WT-sibling (+MET) larvae were subjected to 6 h of MSD. White and black bars represent light and dark periods, respectively, and gray bars represent MSD (E). At ZT20 (black arrowhead, E), sleep time (F) and c-fos (G) expression were quantified. MSD did not affect sleep time (n = 48, F) or c-fos expression (n = 60, F) in WT-sibling larvae. In contrast, following MSD, HCRT neuron-ablated larvae showed reduced sleep (n = 48; *p < 0.05, Student's t test; F) and increased c-fos expression (n = 60, ***p < 0.001, two-way ANOVA; G). Four independent MSD experiments were performed to quantify c-fos and sleep time. Values are represented as means ± SEM.

