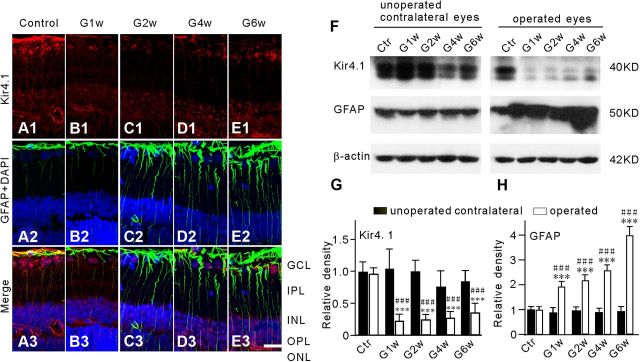
Figure 3.
Changes in Kir4.1 and GFAP expression in Müller cells of COH rats. A1–E1, Immunofluorescence labeling showing the changes in Kir4.1 protein expression in rat retinal vertical slices taken from sham-operated retina (Control), and those obtained at the first (G1w), second (G2w), fourth (G4w), and sixth week (G6w) after the operation. Note that Kir4.1 expression in the endfeet of Müller cells was reduced in the COH retinal sections (B1, C1, D1, E1). A2–E2, Immunohistochemical staining showing DAPI and GFAP protein expression in the same slices as shown in A1, B1, C1, D1, and E1, respectively. C3–E3, Merged images of A1–E1 and A2–E2. Scale bar, (for all the images) 20 μm. IPL, Inner plexiform layer; INL, inner nuclear layer; ONL, outer nuclear layer. F, Representative immunoblots showing the changes in Kir4.1 (top) and GFAP (middle) protein expression in sham-operated (Ctr) and COH retinal extracts obtained from both operated eyes and their unoperated contralateral eyes in the same rats at different time points (G1w, G2w, G4w, and G6w) after the operation. G, H, Bar charts summarizing the average densitometric quantification of immunoreactive bands of Kir4.1 (G) and GFAP (H) protein expression at different time points after the operation. All data are normalized to control (Ctr). n = 6 all groups. ***p < 0.001 versus the unoperated contralateral eyes in the same rats, and ###p < 0.001 versus Ctr.

