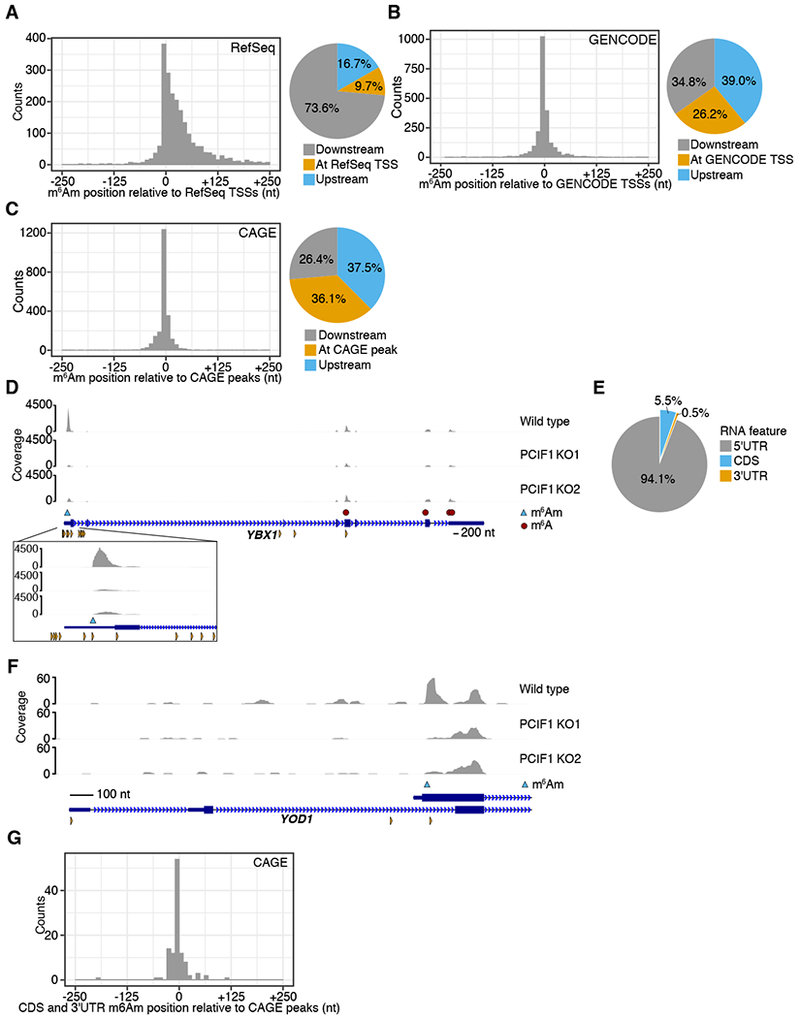
Figure 4. Internally mapped m6Am sites reflect m6Am in mRNA isoforms with alternative TSSs.

A. A metaplot centered on the closest RefSeq TSS for each called m6Am site shows most m6Am sites are found downstream of the annotated start site, but not at the annotated start site. The proportion of m6Am directly at the annotated TSS, or up- or downstream is shown.
B. A metaplot analysis of m6Am locations using GENCODE TSS annotations shows higher overlap with TSSs. GENCODE annotations include more transcript isoforms and TSSs than RefSeq.
C. A metaplot of the distance from each m6Am site to the closest CAGE peak in the FANTOM5 database shows that m6Am sites are indeed TSSs. Here, the overlap of m6Am was highest, suggesting that m6Am sites are selectively localized to TSSs and not internal nucleotides within mRNA.
D. The m6Am mapping to the annotated 5′UTR of the YBX1 transcript reflects a transcript isoform. The PCIF1-dependent 6mA peak in YBX1 maps within the annotated 5′UTR of YBX1. However, this peak overlaps with a CAGE site (orange triangles), indicating the existence of a transcript isoform that initiates at this 6mA site. m6Am peaks that appear within the 5′UTR reflect m6Am in transcript isoforms with alternative TSSs. The exact m6Am site (blue triangle) was determined using the A to T transition within the PCIF1-dependent peak.
E. Most m6Am are found in the annotated 5′UTR of transcripts.
F. The internally mapping m6Am in YOD1 derives from a TSS of a YOD1 transcript isoform. The m6Am peak in YOD1 begins beyond the start codon of both annotated isoforms. CAGE peaks (orange triangles) suggest this is indeed a TSS.
G. A metaplot analysis of CDS and 3′UTR mapping m6Am sites show overlap with CAGE data, indicating that m6Am occurs at TSSs. The closest CAGE peak to each of the 6% of sites that appeared to not map to the 5′UTR (E) was calculated and plotted.
See also Figure S3.
