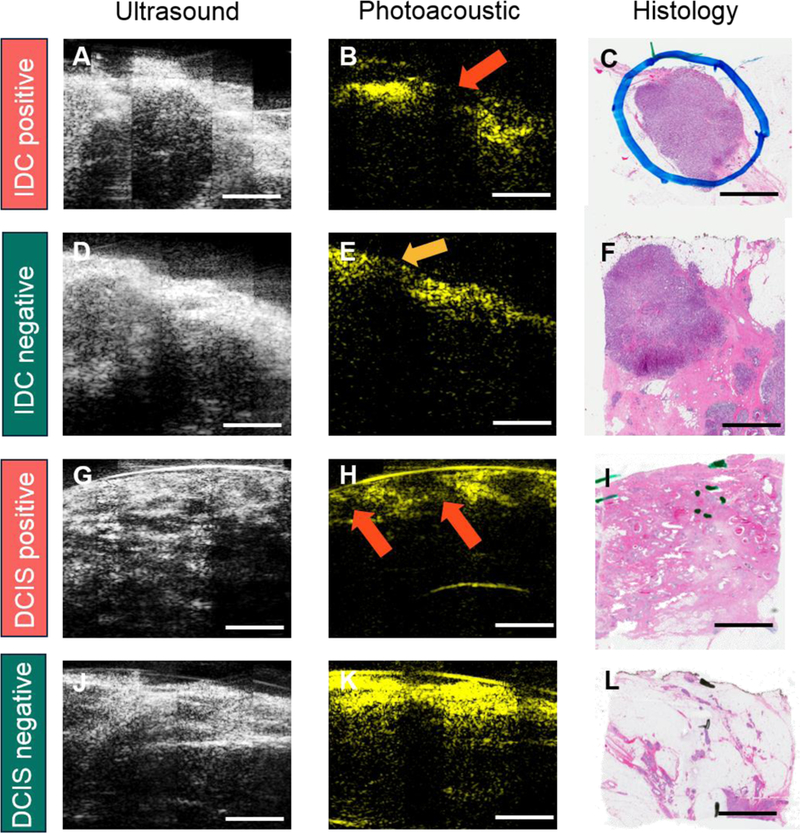
Figure 4.

Representative images of different margins from IDC and DCIS specimens. A-C) IDC positive margin with ultrasound, photoacoustic, and H&E images. D-F) IDC negative margin with ultrasound, photoacoustic, and H&E images. G-I) DCIS positive margin with ultrasound, photoacoustic, and H&E images. J-L) DCIS negative margin with ultrasound, photoacoustic, and H&E images. Red arrow in the first row indicates cancer protruding the margin. Orange arrow in the second row shows the cancer is covered by adipose tissue. The two red arrows in the third row indicate in-situ cancer covering by adipose tissue with the thickness less than 2 mm. Scale bar: 3 mm.
