Figure 1.
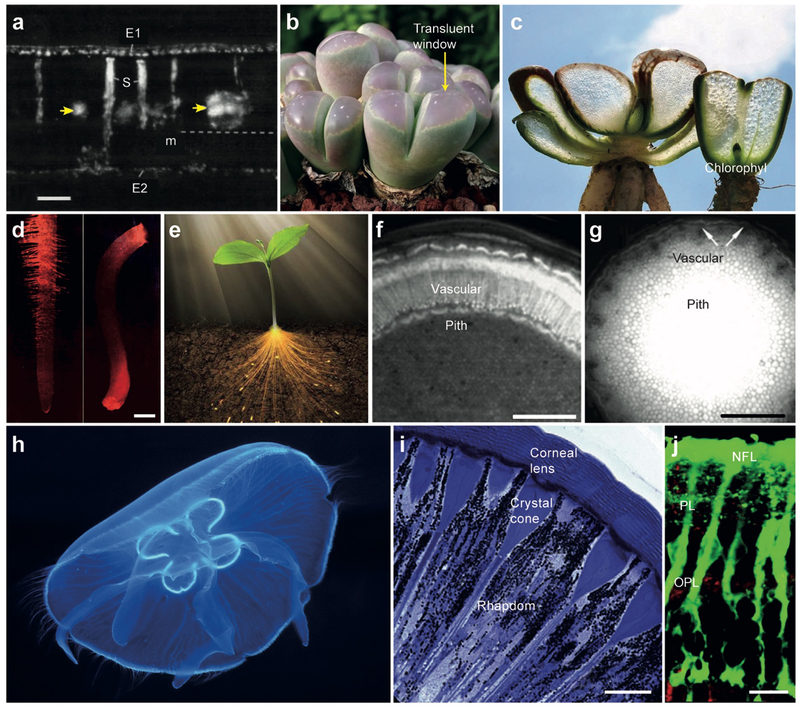
Optical waveguiding structures in living organisms. (a) Hand-cut transverse section of a matur leaf of P. latifolia under polarized light. E1: adaxial epidermis, E2: abaxial epidermis, m: mesophyll, S: osteosclereids. Yellow arrows indicates veins, and dotted line indicates paradermal section.[8] Scale bar, 100 μm. (b) Lithops olivacea with green bodies and large pinkish translucent windows through which sunlight penetrate into the leaf.[9] (c) Fenestrated Haworthia and Lithops with translucent tissues.[89] (d) Optical images of red laser light guided in (left) in a corn root and (right) in an oat seedling.[10] Scale bar, 1 mm. (e) Artistic drawing of a plant, illustrating light guiding through the stem to the roots.[13] (f) A cross-section image of the stem of a one-year-old Aesculus turbinate. More efficient light guiding in the vascular tissue than in pith.[12a] Scale bar, 1 mm. (g) A cross-section image of the stem of a Fallopia japonica var. uzenensis. More efficient light conduction in pith than in vascular bundles.[12b] Scale bar, 1 cm. (h) An inch-long jellyfish emitting bioluminescence light guided through its transparent tissues.[90] (i) A cross-section imaging showing the longitudinal organization of ommatidia in Australian desert ant..[91] Scale bar, 10 μm. (j) A cross-sectional fluorescence imaging of a pig retina tissue slice, showing Muller cells stained with a fluorescent dye (green). IPL: inner plexiform layer, OPL: outer plexiform layer, NFL: nerve fiber layer.[20a] Scale bar, 10 μm.

