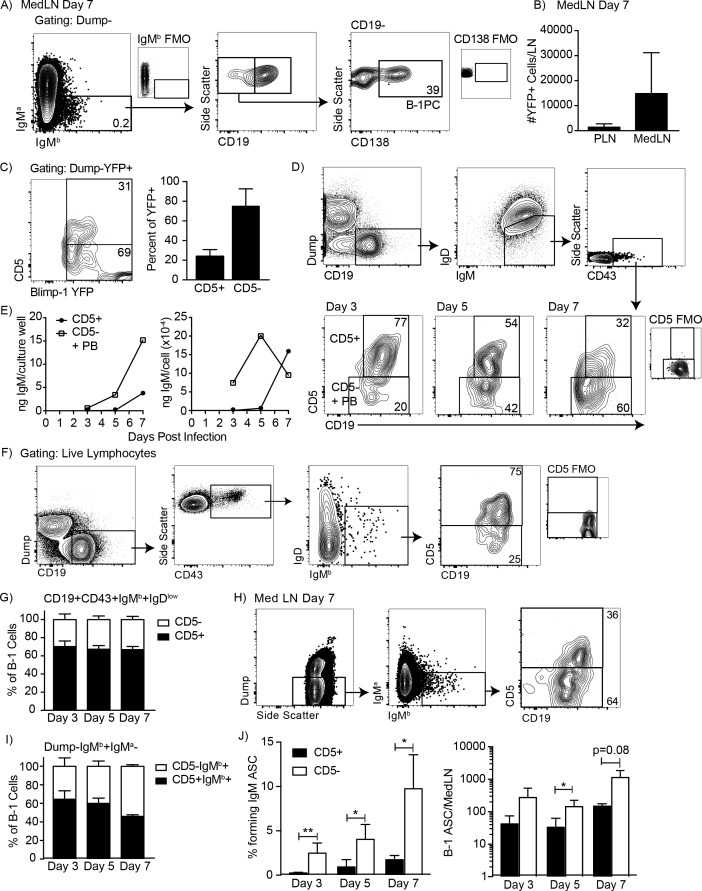
Figure 1. CD5 negative B-1 cells secrete most IgM in the mediastinal lymph nodes (MedLN) after influenza infection.
(A) FACS plot of MedLN cells from day seven influenza-A/PR8-infected neonatal chimeric mice generated with Ighb B-1 donor cells and Igha host cells. Shown is gating to identify IgMb+CD19+B-1 cells and IgMb+CD19 CD138+B-1PC. FMO, ‘fluorescence minus one’ control stains. (B) Mean number ± SD of Blimp YFP+ cells in peripheral LN (PLN) and MedLN of day seven influenza-infected neonatal chimera generated with B-1 donor cells from Blimp-1-YFP mice (n = 4). (C) FACS plot (left) and (right) mean percentage ± SD of CD5+ and CD5- cells among total Blimp-1 YFP+ cells (n = 13). (D) FACS gating strategy for sorting CD19+IgM+IgDloCD43+CD5+ or CD5- cells in the MedLN on days 3, 5, or seven after influenza infection of C57BL/6 mice, pooled from n = 2–3 per time point. (E) Concentration (ng/ml) IgM in supernatant (left) and secreted (ng x 10−4) per cell (right) of sorted cells measured by ELISA. (F) FACS gating strategy and (G) mean percentage ± SD of CD19+CD43+IgMb+IgDlo and CD5+ or CD5- B-1 cells among at indicated times after infection (n = 6–7 per time point). (H–I) Samples from (G) regated to show total B-1 populations. (H) Sample FACS plot and (I) percentage ± SD of CD5+ and CD5- B-1 cells among total (Dump- IgMb+ IgMa-) B-1 cells at indicated times after infection (n = 6–7 per time point). (J) Mean percentage ± SD (left) and total number ± SD (right) of FACS-sorted CD5+ and CD5- B-1 cells (IgMb+IgMa-) that formed IgM antibody-secreting cells (ASC) in each MedLN, as measured by ELISPOT (n = 3–4 per time point). Results are representative of >4 (A), 3 (B), and 2 (F, I), or are combined from 2 (D, E, G, H) or 3 (C) independent experiments. Values in (I) were compared by unpaired Student’s t test (*=p < 0.05, **=p < 0.005).

