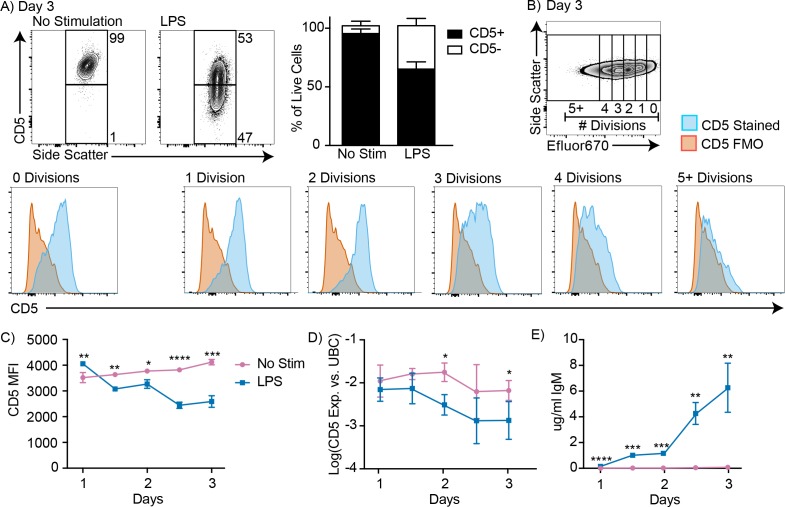
Figure 2. CD5+ B-1 cells decrease CD5 expression after LPS stimulation in vitro.
(A) Representative FACS plots (left) and mean percentage ± SD (right) of CD5+ and CD5- B-1 cells after FACS-purified peritoneal cavity CD19+ CD23- CD5+ B-1 cells were cultured with or without 10 µg/ml LPS for 3 days (n = 18). (B) CD5 expression on FACS-purified Efluor 670-stained proliferating peritoneal cavity CD5+ B-1 cells stimulated with LPS compared to CD5 FMO (fluorescence minus one) control. (C) Mean CD5 MFI ± SD, determined by flow cytometry, (D) mean Log(cd5 mRNA expression) ± SD, determined by qRT-PCR, and (E) mean IgM secretion ± SD (µg/ml), determined by ELISA, after purified peritoneal cavity CD5+ B-1 cells were cultured for indicated times with LPS (n = 3–4 per time and data point). Results are combined from 4 (A), or are representative of >5 (B), and 2 (C-E) independent experiments, respectively. Values in (C–E) were compared using an unpaired Student’s t test (*=p < 0.05, **=p < 0.005, ***=p < 0.0005, ****=p < 0.00005).


