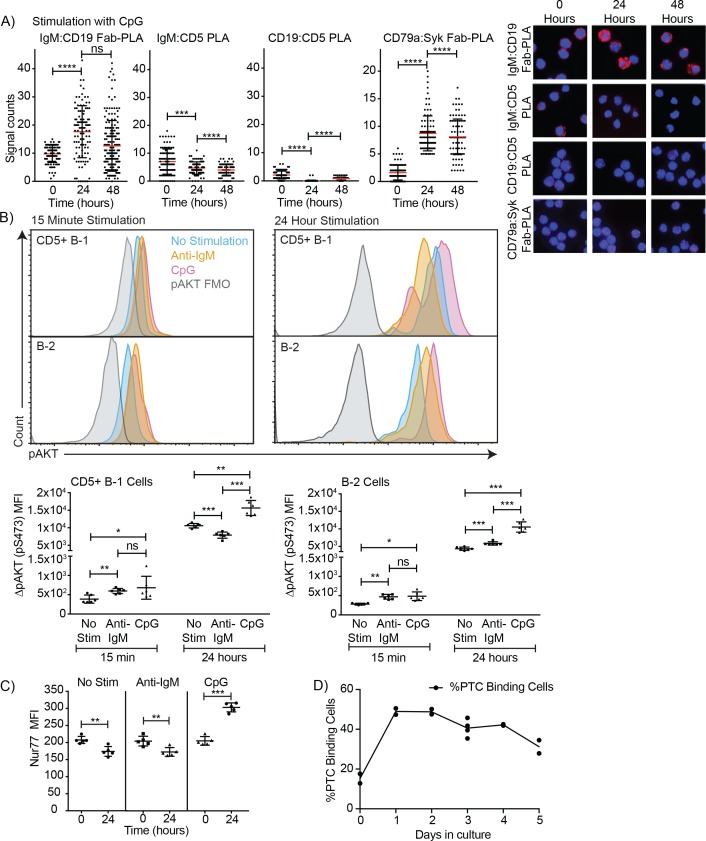
Figure 6. TLR-mediated stimulation of CD5+ B-1 cells alters the BCR-signalosome.
(A) FACS-purified peritoneal cavity CD19hi CD23- CD43+ CD5+B-1 and splenic CD19+ CD23+ CD43 CD5- B-2 cell of BALB/C mice were stimulated for the indicated times with TLR9-agonist ODN7909 prior to analysis by proximal ligation assay, probing for the following interactions (left to right): IgM:CD19, IgM:CD5, CD19:CD5 and CD79:syk. Left panel summarizes data on signal counts for 200 individual cells analyzed. Each symbol represents one cell, horizontal line indicates mean signal count per cell. Right panel show representative fluorescent images. (B) Analysis of the phosphorylation status of Akt by probing for Akt pS473 by flow cytometry on FACS-purified CD19hi CD23- CD5+ CD43+ B-1 cells from the peritoneal cavity and CD19+ CD23+splenic B-2 cells of BALB/C mice. Top panels show representative histogram plots, bottom summarizes the results. (C) Mean fluorescence intensity ± SD of staining for the immediate early activation factor Nur77, in CD5+ B-1 cells isolated as described in (A) and cultured for up to 2 days in the absence and presence of the indicated stimuli. (D) Shown are % frequencies of live PtC-binding B-1 cells among live FACS-purified CD5+ peritoneal cavity B-1 cells cultured with LPS stimulation for the indicated times, as assessed by flow cytometry. Each symbol represents results obtained from one culture well. Results are representative from experiments conducted at least twice with multiple repeats done per experiment (n = 2–5). Results in D are combined from two independent experiments. Values were compared using an unpaired Student’s t test (*=p < 0.05, **=p < 0.005, ***=p < 0.0005).

