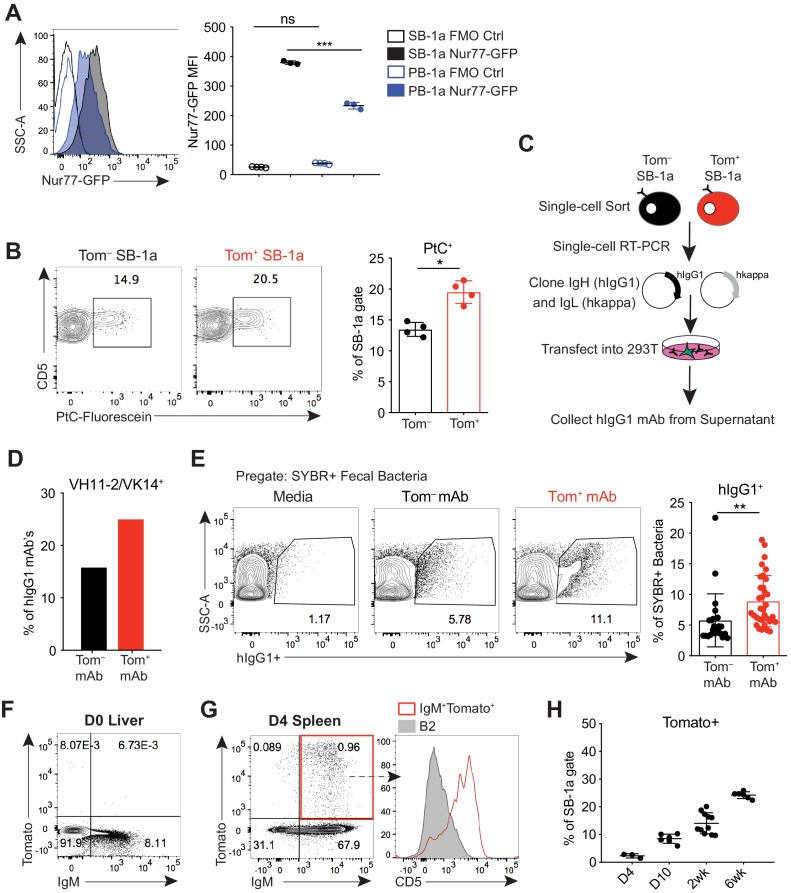
Figure 2. B-1a cells have a history of B cell receptor-mediated activation.
(A) Representative flow cytometry histogram (left) and quantification of mean fluorescence intensity (right) of GFP expression on splenic (SB-1a) (black) and peritoneal cavity (PB-1a) (blue) B-1a cells (CD19+CD23–CD43+CD5+) in 3 wk old Nur77-GFP reporter mice (filled histogram, closed circles) or reporter-negative mice as controls (FMO Ctrl) (unfilled histogram, open circles). (B) Representative flow cytometry plots (left) and quantification (right) of the percentage of Tomato– and Tomato+ splenic B-1a cells from 6 wk old Ighg3T2A-Cre:TdTomato mice stained with fluorescein-labeled phosphatidylcholine liposomes. (C) Schematic showing the generation of hIgG1 recombinant monoclonal antibodies (mAb) from single-cell sorted Tomato– or Tomato+ splenic B-1a cells (SB-1a) from 6wk old Ighg3T2A-Cre:TdTomato mice. There are two source files associated with this figure with a comprehensive description of all of the mAbs generated. (D) The percentage VH11-2/VK14 gene usage in monoclonal antibodies (mAbs) generated from Tomato– (black) and Tomato+ (red) splenic B-1a (SB-1a) cells from 6 wk old Ighg3T2A-Cre:TdTomato mice, as described in (C); Tom+ mAb n= 48; Tom– mAb n= 37. (E) Representative flow cyometry plots (left) and quantification (right) of pregated SYBR+ fecal bacteria bound by recombinant hIgG1 monoclonal antibodies generated as described in (C); PtC-reactive VH11-2/VK14 expressing mAb’s were excluded from this analysis; Tom+ mAb n= 32; Tom– mAb n= 23. (F) Representative flow cytometry plot of IgM versus Tomato expression in pre-gated CD19+ D0 liver cells or (G) CD19+ D4 spleen cells from Ighg3T2A-Cre:TdTomato mice; representative flow cytometry histogram of CD5 expression on pre-gated CD19+IgM+Tomato+ D4 spleen cells (red, unfilled) compared to CD19+IgM+CD23+CD43–CD5– B2 cells (gray, filled) (G, right). (H) Quantification of percentage Tomato expression in B-1a cells from the spleens (SB-1a) of D4, D10, 2 wk, and 6 wk old Ighg3T2A-Cre:TdTomato mice by flow cytometry. Error bars indicate the mean (± SEM). *p<0.05, **p<0.01, and ***p<0.001 (unpaired two-tailed Student's t-test (B, E) or one-way ANOVA (A)). Each data point represents an individual mouse (A,B,H) or monoclonal antibody (E). Data are representative of at least three independent experiments (A-B, E-H).

