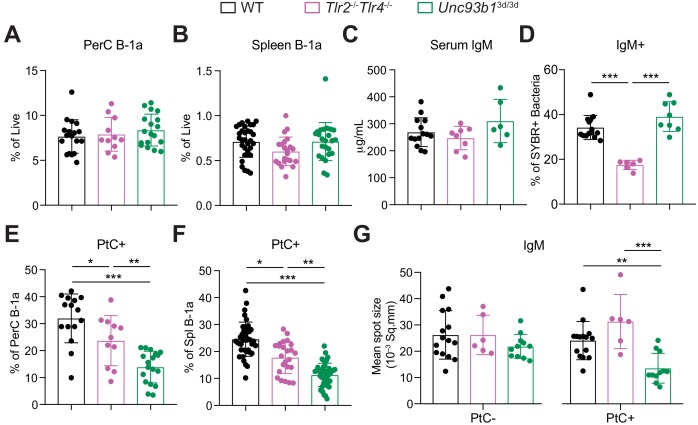
Figure 5. TLR2 and TLR4 regulate B-1a responses to the microbiota, whereas Unc93B1-dependent TLRs regulate phosphatidylcholine-reactive B-1a responses.
(A–B) Frequency of live B-1a cells in 7 wk old WT (black), Tlr2-/-Tlr4-/- (pink), or Unc93b13d/3d (green) mice in the (A) peritoneal cavity (PerC) and (B) spleen, as measured by flow cytometry. (C) Serum IgM titers in 7 wk old WT (black), Tlr2-/-Tlr4-/- (pink), or Unc93b13d/3d (green) mice, as measured by ELISA. (D) Percentage of SYBR+μMT-/- fecal bacteria bound by serum IgM from 7 wk old WT (black), Tlr2-/-Tlr4-/- (pink), or Unc93b13d/3d (green) mice, as measured by flow cytometry. (E-F) Percentage fluorescein-labeled phosphatidylcholine-liposome positive (PtC+) (E) peritoneal cavity (PerC) B-1a and (F) spleen (Spl) B-1a cells in 7 wk old WT (black), Tlr2-/-Tlr4-/- (pink), or Unc93b13d/3d (green) mice, as measured by flow cytometry. (G) Quantification of the mean spot size of IgM secreted by sorted PtC– (left) or PtC+ (right) splenic B-1a cells from WT (black), Tlr2-/-Tlr4-/- (pink), or Unc93b13d/3d (green) mice after 20 hr in culture, as measured by ELISpot. Error bars indicate the mean (± SEM). *p<0.05, **p<0.01, and ***p<0.001 (One-way ANOVA). Each data point represents an individual mouse. Data are pooled from at least three independent experiments (A-G).

