. 2019 Aug 21;8:e47015. doi: 10.7554/eLife.47015

Figure 6. B-1a immunoglobulin repertoire analysis reveals unique regulation of a subset of heavy chain genes by distinct subsets of TLRs.

(A) Representative flow cytometry gating strategy for sorting IgM+IgDloCD43+CD5+B-1a cells (pregated as CD19+/DAPI) in the peritoneal cavity (PerC) (left) and spleen (right). Prior to sorting, splenocytes were depleted of CD3+CD4+CD8+F4/80+NK1.1+GR-1+ cells using biotinylated antibodies and streptavidin magnetic beads. (B-C) The percentage of heavy chain CDR3 nucleotide sequencing reads expressing the germline (B) VH9-3 allele or the (C) VH3-6 allele in peritoneal cavity (PerC) (left) and spleen (right) B-1a samples (% usage). (D) Percentage of pre-gated SYBR+ fecal bacteria bound by two individual recombinant hIgG1 monoclonal antibodies (#1 and #2) expressing the germline VH3-6 allele generated from splenic B-1a cells from 6 wk old mice, described in Figure 2C, as measured by flow cytometry. (E) The percentage of heavy chain CDR3 nucleotide sequencing reads expressing the germline VH11-2 allele in peritoneal cavity (PerC) (left) and spleen (right) B-1a samples (% usage). (F) The combined normalized read counts of PtC-binding CDR3 peptide sequences (MRYSNYWYFDV, MRYGSSYWYFDV, and MRYGNYWYFDV) in peritoneal cavity (PerC) (left) and spleen (right) B-1a samples. Black circles represent WT mice, blue circles represent Tlr2-/-Tlr4-/-Unc93b13d/3d mice, green circles represent Unc93b13d/3d mice, and pink circles represent Tlr2-/-Tlr4-/- mice (B, C, E, F). CDR3 frequencies were artificially scaled to 10 million reads to account for differences in read depth among samples (F). Error bars indicate the mean (± SEM). *p<0.05, **p<0.01, and ***p<0.001 (One-way ANOVA). Each data point represents an individual mouse (B, C, E, F). Data representative of 3 independent experiments (D). There are three source files associated with this figure.

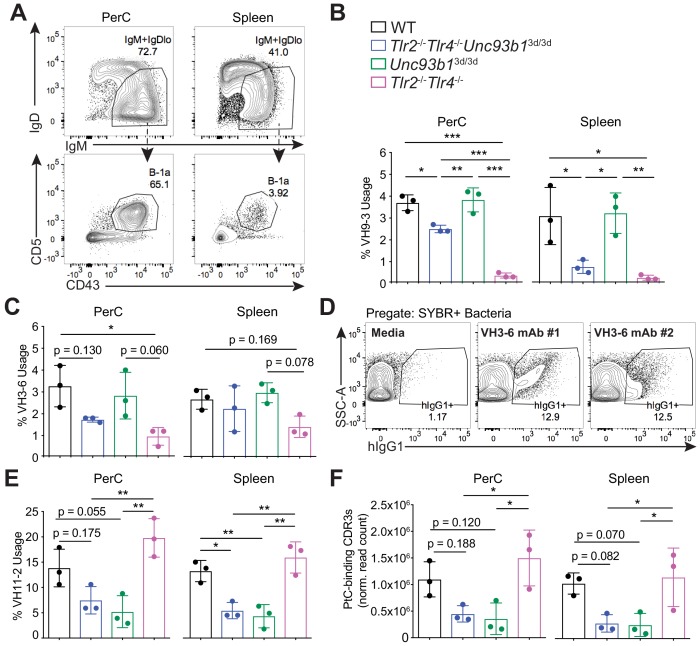
Figure 6—source data 1. Top 10 highly recurring CDR3 sequences (peptide and V(D)J recombination) detected in peritoneal cavity B-1a samples from age-matched mice lacking different subsets of TLRs.
The CDR3 peptide sequence, variable heavy chain gene, joining heavy chain gene, total read counts (copy), normalized read counts (norm.copy), and the sum of normalized counts of PtC-binding CDR3 peptide sequences in peritoneal cavity (PerC) B-1a samples from 7 wk old WT (black), Tlr2-/-Tlr4-/-Unc93b13d/3d (blue), Tlr2-/-Tlr4-/- (pink), and Unc93b13d/3d (green) mice. PtC-binding CDR3 peptide sequences include MRYSNYWYFDV (highlighted in blue), MRYGSSYWYFDV (highlighted in orange), and MRYGNYWYFDV (highlighted in purple). CDR3 sequences in italic font denotes that they did not appear in the top 10 CDR3 sequences for that sample, but were included to be able to determine the sum of PtC-binding CDR3 sequencing reads. Sequencing reads were normalized by artificially scaling to 10 million reads to account for differences in read depth among samples. There are three biological replicates for each genotype in one experiment.
DOI: 10.7554/eLife.47015.019
Figure 6—source data 2. Top 10 highly recurring CDR3 sequences (peptide and V(D)J recombination) detected in spleen B-1a samples from age-matched mice lacking different subsets of TLRs.
The CDR3 peptide sequence, variable heavy chain gene, joining heavy chain gene, total read counts (copy), normalized read counts (norm.copy), and the sum of normalized counts of PtC-binding CDR3 peptide sequences in spleen (Spl) B-1a samples from 7 wk old WT (black), Tlr2-/-Tlr4-/-Unc93b13d/3d (blue), Tlr2-/-Tlr4-/- (pink), and Unc93b13d/3d (green) mice. PtC-binding CDR3 peptide sequences include MRYSNYWYFDV (highlighted in blue), MRYGSSYWYFDV (highlighted in orange), and MRYGNYWYFDV (highlighted in purple). CDR3 sequences in italic font denotes that they did not appear in the top 10 CDR3 sequences for that sample, but were included to be able to determine the sum of PtC-binding CDR3 sequencing reads. Sequencing reads were normalized by artificially scaling to 10 million reads to account for differences in read depth among samples. There are three biological replicates for each genotype in one experiment.
DOI: 10.7554/eLife.47015.020
Figure 6—source data 3. Variable heavy chain gene usage summary in spleen and peritoneal cavity B-1a cells in mice lacking different subsets of TLRs.
Table summarizing the variable heavy chain gene usage frequency in peritoneal cavity and spleen B-1a samples from 7 wk old WT (black), Tlr2-/-Tlr4-/-Unc93b13d/3d (blue), Tlr2-/-Tlr4-/- (pink), and Unc93b13d/3d (green) mice. There are three biological replicates for each genotype in one experiment.
DOI: 10.7554/eLife.47015.021

Figure 6.

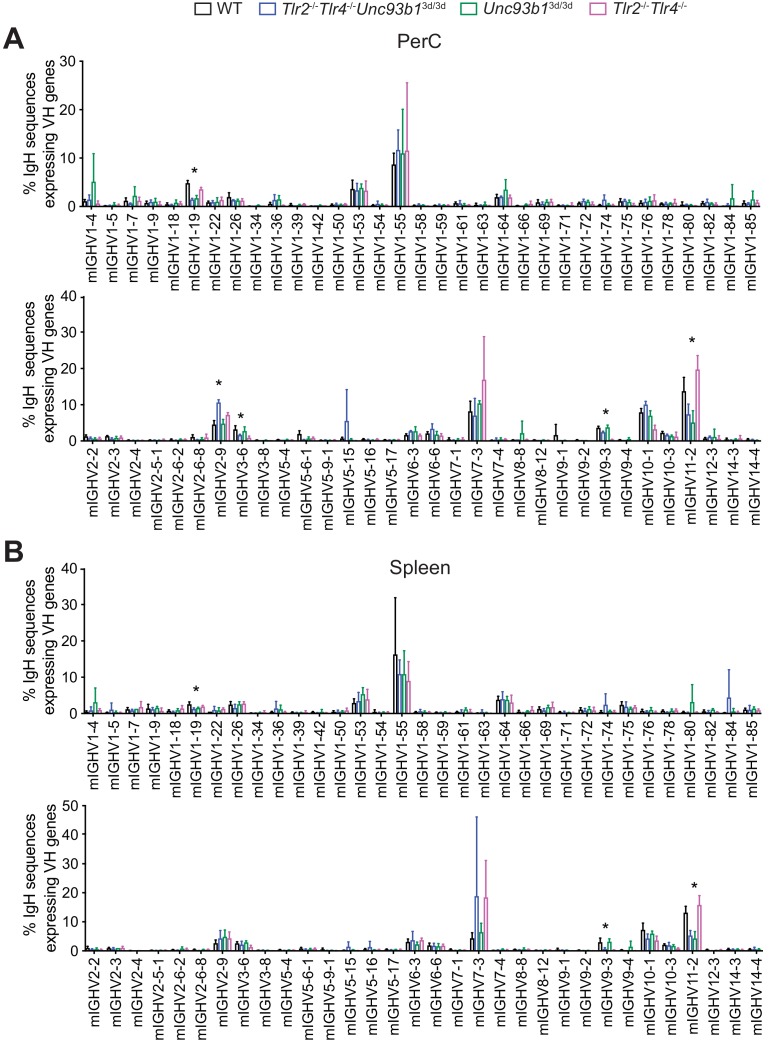
Figure 6—figure supplement 1. VH gene-usage distribution in splenic and peritoneal cavity B-1a samples.

Figure 6—figure supplement 1.

(A–B) The percentage of heavy chain CDR3 nucleotide sequencing reads expressing different germline V-alleles in (A) peritoneal cavity (PerC) and (B) spleen B-1a samples from 7 wk old WT (black), Tlr2-/-Tlr4-/-Unc93b13d/3d (blue), Tlr2-/-Tlr4-/- (pink), or Unc93b13d/3d (green) mice. Each data point represents an individual mouse. Error bars indicate the mean (± SEM). *p<0.05, **p<0.01, and ***p<0.001 (One-way ANOVA). Asterisks denote a statistical difference in a unique Ig VH gene between at least two different genotypes.
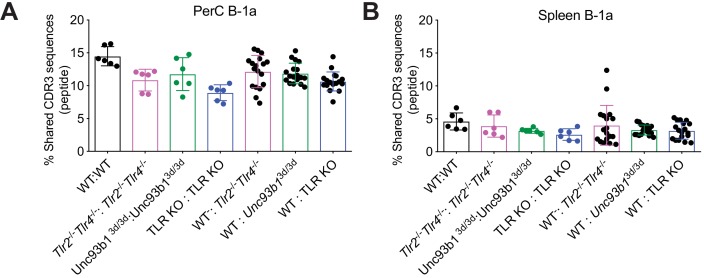
Figure 6—figure supplement 2. There is considerable variation in B-1a IgH CDR3 repertoire between different mice, independent of TLR signaling.

Figure 6—figure supplement 2.

(A–B) CDR3 peptide pair-wise sharing analysis of IgH repertoire similarity between (A) peritoneal cavity (PerC) and (B) spleen B-1a samples from 7 wk old WT (black), Tlr2-/-Tlr4-/- (pink), Unc93b13d/3d (green), or TLR KO (blue) mice. CDR3 peptide pair-wise analysis was conducted between WT mice (WT/WT), Tlr2-/-Tlr4-/- mice (Tlr2-/-Tlr4-/-/Tlr2-/-Tlr4-/-), Unc93b13d/3d mice (Unc93b13d/3d/Unc93b13d/3d), TLR KO mice (TLR KO/TLR KO) and between WT vs Tlr2-/-Tlr4-/- mice (WT/Tlr2-/-Tlr4-/-), WT vs. Unc93b13d/3d mice (WT/Unc93b13d/3d), and WT vs TLR KO mice (WT/TLR KO). TLR KO mice refers to Tlr2-/-Tlr4-/-Unc93b13d/3d mice. Each dot represents the percentage of shared CDR3 peptide sequences between two mice. A total of 3 mice per genotype were included in the analysis, yielding six pair-wise comparisons within the same genotype ((% shared CDR3 in WT1 and WT2)/(Total CDR3 sequences in WT 1), (% shared CDR3 in WT1 and WT2)/(Total CDR3 sequences in WT 2), etc.) and 18 pair-wise comparisons when comparing two different genotypes. Data are presented as percentage of total CDR3 nucleotide sequencing reads. CDR3 frequencies were artificially scaled to 10 million reads to account for differences in read depth among samples, and a CDR3 frequency of 1000 was set as the minimum cutoff for pairwise-analysis. There are three source files associated with this figure.