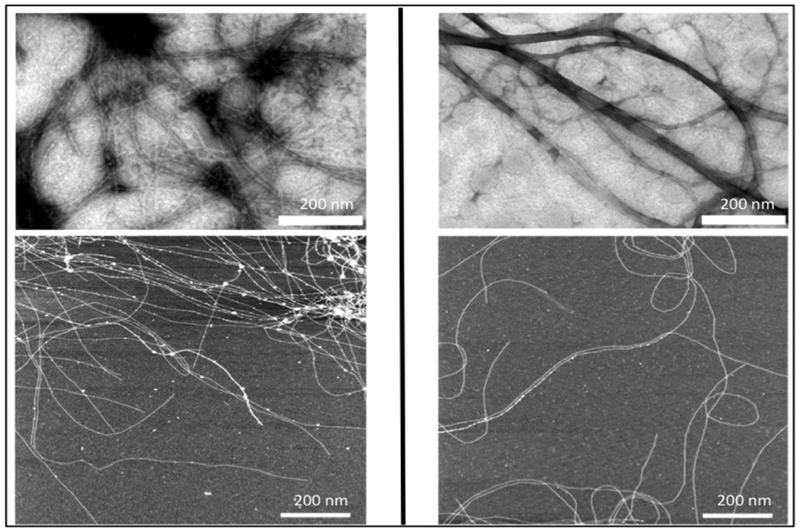
Figure 2.2-8.

TEM images (top) and AFM images (bottom) of CSSC (left) and SCCS (right) supramolecular structures. The white bar indicates 200 nm. It can be clearly seen from both images that CSSC and SCCS form nanotape microstructures and self-assembly into fibrils. Reproduced with permission from Ref. [119] Copyright 2009, American Chemical Society.
