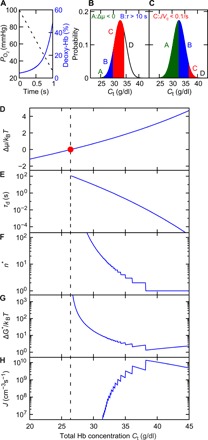
Fig. 3. Deoxygenation and fraction of sickled RBCs in hepatic vein.

(A) The linear decrease of PO2 from 100 to 28.1 mmHg in 1 s (dashed line) enforces deoxygenation of hemoglobin from 4.3 to 49% correspondingly (blue curve). Fractions of RBCs classified according their sickling propensities in the hepatic vein of (B) SCD patients and (C) SCT individuals correspondingly. Areas A, B, C, and D denote fractions of RBCs with distinct polymerization propensities at PO2 = 28.1 mmHg. Area A: Deoxy HbS is undersaturated. Area B: The nucleation delay time is longer than 10 s. Area C: Less than 1 polymer is generated via homogeneous nucleation within 10 s. Area D: RBCs are likely to become sickled within 10 s. (D to H) Variation of supersaturation Δμ/kBT (D), delay time τd (E), homogeneous nucleus size n* (F), homogeneous nucleation barrier ΔG* (G), and homogeneous nucleation rate J (H) with respect to the total hemoglobin concentration Ct at the end of deoxygenation. Vertical dash line highlights the beginning of supersaturation.
