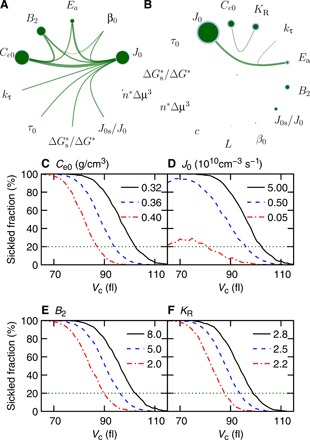
Fig. 6. Global sensitivity analysis illustrates the key model parameters that determine the sickling of RBCs.

(A and B) Global parametric sensitivity analysis on the model parameters with model inputs following an in vitro study (22) (A) and an in vivo study (20) (B). The diameter of green circles is the sensitivity index of each parameter (first-order sensitivity index). The blue ring outside the green circle is the 95% confidence interval of the sensitivity index. The thickness of lines between two parameters is the sensitivity index of this two parameter pair (second-order sensitivity index). Sensitivity smaller than 0.01 is not plotted. (C to F) Sensitivity of the correlation between the fraction of sickled RBCs and cell volume Vc at 60 s after deoxygenation to four kinetic parameters: (C) Ce0, (D) J0, (E) B2, and (F) KR: The tested values of each parameter are listed in the plots. Black lines denote the default model parameters. Horizontal green dashed lines mark the threshold value of sickled fractions that define the therapeutic effects in (22).
