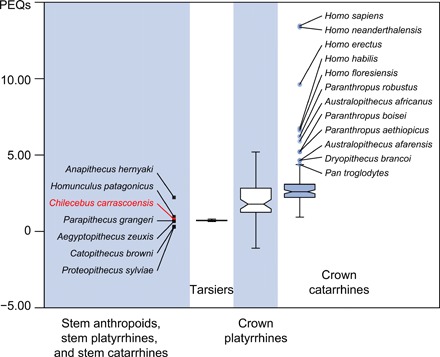
Fig. 2. Notched box-whisker plot of the PEQs of fossil and extant haplorhines.

Whiskers show the lowest datum within 1.5 interquartile range (IQR) of the lower quartile and the highest datum within 1.5 IQR of the upper quartile. Outliers are shown as circles. For stem anthropoids, stem platyrrhines, and stem catarrhines, individual data points rather than the box and whisker are shown. PGLS regression for all anthropoids [x, ln(body mass); y, ln(brain weight); y = 0.50x − 0.87, t = 12.22, and P < 0.001) was used for calculating the PEQs. The PEQs of Dryopithecus, Australopithecus, Paranthropus, and Homo are much higher than in other anthropoids, shown as outliers.
