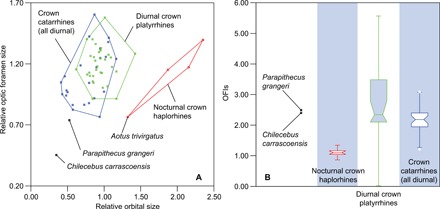
Fig. 4. Relative orbital and optic foramen sizes of fossil and extant haplorhines.

(A) and notched box-whisker plot of the OFIs (B) of fossil and extant haplorhine primates. The relative orbital and optic foramen sizes were calculated by dividing the observed values by the expected values calculated from the PGLS regression for ln(orbital area) against ln(body mass) and ln(optic foramen area) against ln(body mass). OFIs were calculated by dividing orbital area by optic foramen area. Whiskers show the lowest datum within 1.5 IQR of the lower quartile and the highest datum within 1.5 IQR of the upper quartile. Outliers are shown as dots.
